chart MouseOver grabbing Pòints to Range

doriangrey

Board Regular
Joined
Jan 18, 2012
Messages
57
Hi Partners,

i want grab All Points on MouseOver of embeded Chart to new Range columns X,Y on MouseOver event and other approach option on standard module.

i want get the All Points of chart on MouseOver without click on point, and Not all point of series.

like Array of Points on MouseMove and put on range of cells 2 columns x y .

vba routine please.

thanks!


not solution here
https://www.excelforum.com/excel-charting-and-pivots/1180645-chart-mouseover-grabbing-points-to-range.html
 
Domenic,
i have a problem: only 239 rows of column collect data, i need "infinite" rows.
i need infinite rows of points, the code collect only 239 rows.
 
Last edited:
Upvote 0

Excel Facts

Which Excel functions can ignore hidden rows?
The SUBTOTAL and AGGREGATE functions ignore hidden rows. AGGREGATE can also exclude error cells and more.
It should not stop at 239 rows. Did you hit Esc? Or did you select a cell outside of the chart area? Did you make changes to the code and forget to re-enable events? Did you break or reset the code?
 
Upvote 0
Also, when you close and re-open your workbook, it starts over from Row 2. If this is not what you want, and you want it to continue from where you left off, let me know and I'll make changes to the code when I get a chance. Not sure when I'll be able to get to it, though. Also, what if you reach the last row of the worksheet? Do you want to continue in the next columns? Something else?
 
Last edited:
Upvote 0
Hi, Domenic,

no, i am not modified the code, not press key, not other problem, only problem is code stop collect points like screenshot, i start in top and move the mouse in circular movement to final or initial point.
I need only same code but more points. AND
" if you reach the last row of the worksheet? Do you want to continue in the next columns?" YES, YES.
The coordinates in the columns x and y are the new points collected with your code.
see screenshot.

https://s-media-cache-ak0.pinimg.com/originals/12/b8/51/12b851a3f761cc5b215a7d79817c7a97.png
12b851a3f761cc5b215a7d79817c7a97.png
 
Last edited:
Upvote 0
Hi, Domenic,

i tested again your code with new workbook file and works perfect, only appear more tremulous the lines of drawing.


please 2versions of new code with:

2all versions with: " if you reach the last row of the worksheet Do you want to continue in the next columns?" YES, YES.
1one version with
"When you close and re-open your workbook, want it to continue from where you left off." (new approach)
1one version with :"When you close and re-open your workbook, it starts over from Row 2." (same actual approach)

thanks!
 
Last edited:
Upvote 0
Here's the revised code for the same approach...

Code:
[COLOR=darkblue]Option[/COLOR] [COLOR=darkblue]Explicit[/COLOR]

[COLOR=darkblue]Public[/COLOR] [COLOR=darkblue]WithEvents[/COLOR] target [COLOR=darkblue]As[/COLOR] Chart

[COLOR=darkblue]Dim[/COLOR] PrevPoint [COLOR=darkblue]As[/COLOR] [COLOR=darkblue]Long[/COLOR]
[COLOR=darkblue]Dim[/COLOR] bNew [COLOR=darkblue]As[/COLOR] [COLOR=darkblue]Boolean[/COLOR]

[COLOR=darkblue]Private[/COLOR] [COLOR=darkblue]Sub[/COLOR] target_Activate()
    PrevPoint = 0
    bNew = [COLOR=darkblue]True[/COLOR]
[COLOR=darkblue]End[/COLOR] [COLOR=darkblue]Sub[/COLOR]

[COLOR=darkblue]Private[/COLOR] [COLOR=darkblue]Sub[/COLOR] target_MouseMove([COLOR=darkblue]ByVal[/COLOR] Button [COLOR=darkblue]As[/COLOR] [COLOR=darkblue]Long[/COLOR], [COLOR=darkblue]ByVal[/COLOR] Shift [COLOR=darkblue]As[/COLOR] [COLOR=darkblue]Long[/COLOR], [COLOR=darkblue]ByVal[/COLOR] x [COLOR=darkblue]As[/COLOR] [COLOR=darkblue]Long[/COLOR], [COLOR=darkblue]ByVal[/COLOR] y [COLOR=darkblue]As[/COLOR] [COLOR=darkblue]Long[/COLOR])

    [COLOR=darkblue]Dim[/COLOR] XVals [COLOR=darkblue]As[/COLOR] [COLOR=darkblue]Variant[/COLOR]
    [COLOR=darkblue]Dim[/COLOR] Vals [COLOR=darkblue]As[/COLOR] [COLOR=darkblue]Variant[/COLOR]
    [COLOR=darkblue]Dim[/COLOR] ElementID [COLOR=darkblue]As[/COLOR] [COLOR=darkblue]Long[/COLOR]
    [COLOR=darkblue]Dim[/COLOR] Arg1 [COLOR=darkblue]As[/COLOR] [COLOR=darkblue]Long[/COLOR]
    [COLOR=darkblue]Dim[/COLOR] Arg2 [COLOR=darkblue]As[/COLOR] [COLOR=darkblue]Long[/COLOR]
    
    [COLOR=darkblue]Static[/COLOR] RowOffset [COLOR=darkblue]As[/COLOR] [COLOR=darkblue]Long[/COLOR]
    [COLOR=darkblue]Static[/COLOR] ColOffset [COLOR=darkblue]As[/COLOR] [COLOR=darkblue]Long[/COLOR]
    
    target.GetChartElement x, y, ElementID, Arg1, Arg2
    
    [COLOR=darkblue]If[/COLOR] ElementID = xlSeries [COLOR=darkblue]Then[/COLOR]
        [COLOR=darkblue]If[/COLOR] bNew [COLOR=darkblue]Then[/COLOR]
            [COLOR=darkblue]If[/COLOR] RowOffset > 0 And RowOffset < Rows.Count - 1 [COLOR=darkblue]Then[/COLOR]
                RowOffset = RowOffset + 1
                Range("N1").Offset(RowOffset, ColOffset).Resize(, 2).Interior.Color = vbYellow
            [COLOR=darkblue]ElseIf[/COLOR] RowOffset = Rows.Count - 1 [COLOR=darkblue]Then[/COLOR]
                RowOffset = 1
                ColOffset = ColOffset + 3
                Range("N1").Offset(RowOffset, ColOffset).Resize(, 2).Interior.Color = vbYellow
            [COLOR=darkblue]End[/COLOR] [COLOR=darkblue]If[/COLOR]
            bNew = [COLOR=darkblue]False[/COLOR]
        [COLOR=darkblue]End[/COLOR] [COLOR=darkblue]If[/COLOR]
        [COLOR=darkblue]If[/COLOR] Arg2 <> PrevPoint [COLOR=darkblue]Then[/COLOR]
            XVals = target.SeriesCollection(Arg1).XValues
            Vals = target.SeriesCollection(Arg1).Values
            [COLOR=darkblue]If[/COLOR] RowOffset = Rows.Count - 1 [COLOR=darkblue]Then[/COLOR]
                RowOffset = 0
                ColOffset = ColOffset + 3
            [COLOR=darkblue]End[/COLOR] [COLOR=darkblue]If[/COLOR]
            RowOffset = RowOffset + 1
            Range("N1").Offset(RowOffset, ColOffset).Value = XVals(Arg2)
            Range("O1").Offset(RowOffset, ColOffset).Value = Vals(Arg2)
            PrevPoint = Arg2
        [COLOR=darkblue]End[/COLOR] [COLOR=darkblue]If[/COLOR]
    [COLOR=darkblue]End[/COLOR] [COLOR=darkblue]If[/COLOR]
    
[COLOR=darkblue]End[/COLOR] [COLOR=darkblue]Sub[/COLOR]

If you want to limit the number of rows to, let's say 500 rows, replace each instance of...

Code:
Rows.Count

with

Code:
500

For testing purposes, though, you may want to temporarily replace it something smaller, such as 10. Unfortunately, I haven't had a chance to change the code to the new approach, but you can at least start testing this one. Hopefully it works the way you want it.
 
Upvote 0
Hi, Domenic,

i tested again your code with new workbook file and works perfect, only appear more tremulous the lines of drawing.


please 2versions of new code with:

2all versions with: " if you reach the last row of the worksheet Do you want to continue in the next columns?" YES, YES.
1one version with
"When you close and re-open your workbook, want it to continue from where you left off." (new approach)
1one version with :"When you close and re-open your workbook, it starts over from Row 2." (same actual approach)

thanks!

Edit: Domenic, please, more 1one line of code to clear original cell of point exactly after copy the coord of point to new column. Only a line of code and iam disable this line with apostrophe if i not need use them.
 
Upvote 0
Hi, Domenic,

I tested the new code.

Your first code worked perfect, i am mistake about de limit of rows, my error about select range DataSource of Chart.

Your actual code only works if i not close and reopens the Workbook.

If i close and reopen the workbook the code restart drawing a line conected with other point, i not like this.

i need only restart after jump and coloring next cel but not connect line with previous point, only continues in range of cels.

you actual code is interesting, but i need modification, please.

please, look at previous message about line of code to clear each row of points after copy the coord.

If you need it you can return to the old code

thanks.
 
Last edited:
Upvote 0
Sorry, but I couldn't understand your instructions. Can you please try to re-state your requirements, and provide a sample of the results your expect?
 
Upvote 0
Also, when you close and re-open your workbook, it starts over from Row 2. If this is not what you want, and you want it to continue from where you left off, let me know and I'll make changes to the code when I get a chance. Not sure when I'll be able to get to it, though. Also, what if you reach the last row of the worksheet? Do you want to continue in the next columns? Something else?


Domenic,
Sorry for my misinterpretation, my confusion
His codes worked perfectly. There are no problems.

I was wrong to select the range of cells with data and so did not show all the rows on the chart.
There was no problem with the line limit, I was wrong.


You had correctly understood what I need:
I need 3 versions of the code:

1a version If I re-start the work continues next cell (row) - continue from where I am left off, same column. (Continues segment lines) I will continue the Drawing in same series.

2a version if I re-open the workbook Jump one cell (row) with yellow and continue next cell after yellow, same column (start new segment on the chart) I will continue the drawing in next same series.

3rd version "When you close and re-open your workbook, it starts over from Row 2." (Re-start of code) i will clean the colum and run the code. I will clena Drawing and make new drawing.

all versions with " if you reach the last row of the worksheet Do you want to continue in the next columns?" YES, YES.


All version with a line of code to clear the old original points of original chart (each point), (i am will put apostrophes in this line to disabled this line of code if i not need delete the point and delete the QuotationMarks (apostrophes) if i need delete the point of chart). The code will Clear the point exactly afther copy the point to new column of new chart. MouseOver will delete the point of old chart if i need.

I am going to put apostrophes in this line to disable this line of code if I do not need to delete the point and delte the apostrophes if I need to delete the point of chart ). The code will clear the point exactly afther copy the point to new column of new chart. MouseOver will delete the point of old chart if i need.

1one Old original approach version with continues into next columns at ech series (moving mouse outside the chart or esc key) is one plus option to i have more options to future, including all new changes.

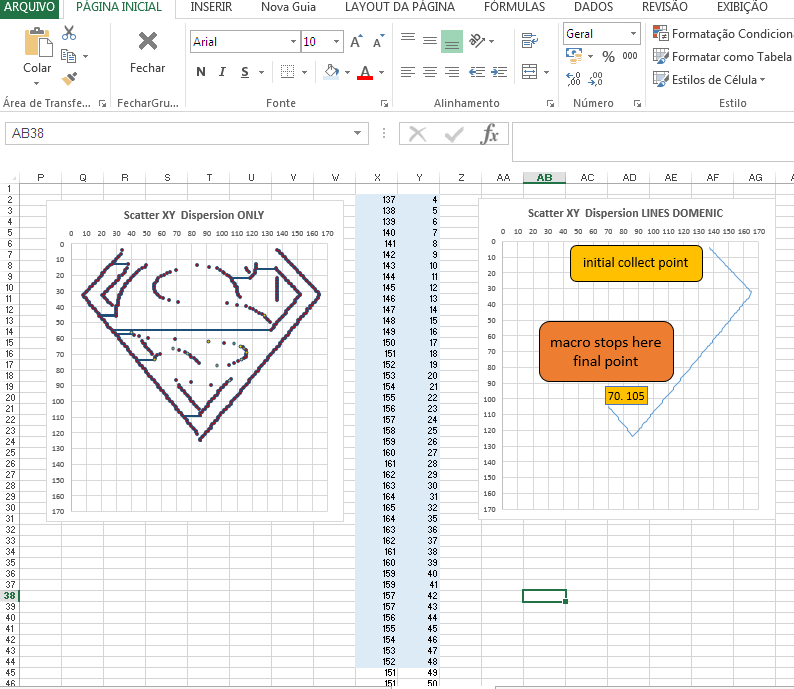
i will make a screenshot to you.
thanks!
 
Last edited:
Upvote 0

Forum statistics

Threads
1,214,829
Messages
6,121,826
Members
449,051
Latest member
excelquestion515

We've detected that you are using an adblocker.

We have a great community of people providing Excel help here, but the hosting costs are enormous. You can help keep this site running by allowing ads on MrExcel.com.
Allow Ads at MrExcel

Which adblocker are you using?

Disable AdBlock

Follow these easy steps to disable AdBlock

1)Click on the icon in the browser’s toolbar.
2)Click on the icon in the browser’s toolbar.
2)Click on the "Pause on this site" option.
Go back

Disable AdBlock Plus

Follow these easy steps to disable AdBlock Plus

1)Click on the icon in the browser’s toolbar.
2)Click on the toggle to disable it for "mrexcel.com".
Go back

Disable uBlock Origin

Follow these easy steps to disable uBlock Origin

1)Click on the icon in the browser’s toolbar.
2)Click on the "Power" button.
3)Click on the "Refresh" button.
Go back

Disable uBlock

Follow these easy steps to disable uBlock

1)Click on the icon in the browser’s toolbar.
2)Click on the "Power" button.
3)Click on the "Refresh" button.
Go back
Back
Top