greenguy2012
New Member
- Joined
- Aug 19, 2018
- Messages
- 4
[FONT="]Hey there,[/FONT]
[FONT="] [/FONT]
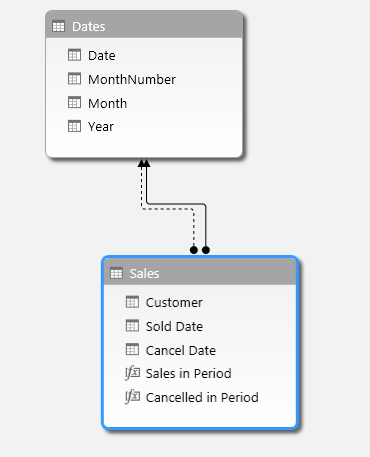
[FONT="]New to DAX so any help is appreciated. My goal is to understand how many customers cancel in a given sold date. Basically how many items did we sell in a given time period vs how many cancelled in that same period. [/FONT]
[FONT="] [/FONT]
[FONT="]What I'm trying to do is count the number of rows where [Cancel Date] column values equal the Pivot Table Row Context Date [Sold Date] grouped by Month. Ex Grouped by Jan Sold Month, 10 cancelled in same Jan period[/FONT]
[FONT="] [/FONT]
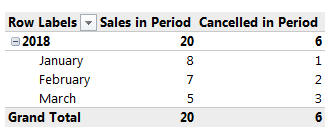
[FONT="]Needed Pivot Table output:[/FONT]
[FONT="] [/FONT]
[FONT="]Sold Month. | Cancel Count[/FONT]
[FONT="]- Jan. | 10[/FONT]
[FONT="]- Feb | 15[/FONT]
[FONT="]- Mar | 20[/FONT]
[FONT="] [/FONT]
[FONT="]Hopefully thats clear. Thanks in advance for your help![/FONT]
[FONT="] [/FONT]
[FONT="]New to DAX so any help is appreciated. My goal is to understand how many customers cancel in a given sold date. Basically how many items did we sell in a given time period vs how many cancelled in that same period. [/FONT]
[FONT="] [/FONT]
[FONT="]What I'm trying to do is count the number of rows where [Cancel Date] column values equal the Pivot Table Row Context Date [Sold Date] grouped by Month. Ex Grouped by Jan Sold Month, 10 cancelled in same Jan period[/FONT]
[FONT="] [/FONT]
[FONT="]Needed Pivot Table output:[/FONT]
[FONT="] [/FONT]
[FONT="]Sold Month. | Cancel Count[/FONT]
[FONT="]- Jan. | 10[/FONT]
[FONT="]- Feb | 15[/FONT]
[FONT="]- Mar | 20[/FONT]
[FONT="] [/FONT]
[FONT="]Hopefully thats clear. Thanks in advance for your help![/FONT]