Hello,
I’ve been searching for an answer for this for 2 days and cannot find a solution or I am not able to understand one if I see it. I’m new to DAX.
I’m trying to create an end product of a Powerpivot report showing sales by: Product Category, Product Number, Product Sales Price, Sales Price Band. A Sales Price Band is a text description like “$0-$100”.
The tricky part is having about 6 Product Categories with each having unique bands. I had a Band Table showing:
<tbody>
</tbody>
I wasn’t sure if I could use one table so I then broke each Category Banding into its own table. One of the band table names is “FT_Chains”.
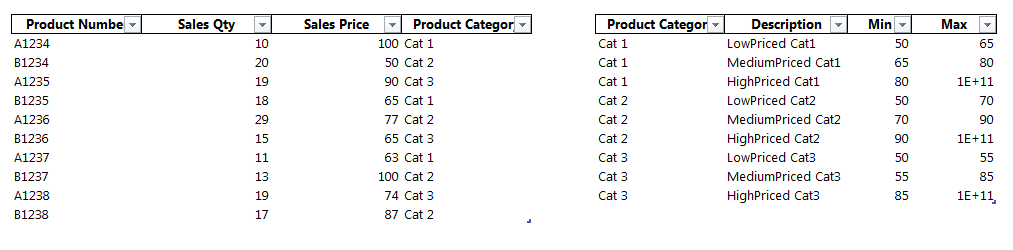
There is another table with Sales Data (table is called “FT_Sales”) with data such as:
<tbody>
</tbody>
There is another table with Product Data (called “FT_Items”) such as:
<tbody>
</tbody>
The sales Data Table uses this formula to pull the Product Category from the Product Data table: =if(isblank(related(DT_Items[Product_Group01])),"2017 or not finished good item",related(DT_Items[Product_Group01]))
I’m using this formula to try to lookup the correct price band: =calculate(values(FT_Tier_Chains[Tier]),filter(FT_Tier_Chains,FT_Sales[Price]>FT_Tier_Chains[Min]&&FT_Sales[Price]<=FT_Tier_Chains[Max]))
That formula pulls the correct band from the FT_Chains banding table but Chains are only one of the many product categories where I need to look up the correct banding by product category.
Can anyone say whether I should have a table for each Product Category banding versus one table with all Categories and their banding?
Can anyone help finish the formula to first look up the banding based on the Product Category?
Thank you so VERY much for any help or thoughts!
I’ve been searching for an answer for this for 2 days and cannot find a solution or I am not able to understand one if I see it. I’m new to DAX.
I’m trying to create an end product of a Powerpivot report showing sales by: Product Category, Product Number, Product Sales Price, Sales Price Band. A Sales Price Band is a text description like “$0-$100”.
The tricky part is having about 6 Product Categories with each having unique bands. I had a Band Table showing:
| Product Category | Band Description | Min | Max |
| Cat 1 | |||
| Cat 2 |
<tbody>
</tbody>
I wasn’t sure if I could use one table so I then broke each Category Banding into its own table. One of the band table names is “FT_Chains”.
There is another table with Sales Data (table is called “FT_Sales”) with data such as:
| Product Number | Sales Qty | Sales Price | Product Category |
| A1234 | 10 | 100 | Cat 1 |
| B1234 | 20 | 50 | Cat 2 |
<tbody>
</tbody>
There is another table with Product Data (called “FT_Items”) such as:
| Product Number | Descr | Product Category |
| A1234 | Widget 1 | Cat 1 |
| B1234 | Widget 2 | Cat 2 |
<tbody>
</tbody>
The sales Data Table uses this formula to pull the Product Category from the Product Data table: =if(isblank(related(DT_Items[Product_Group01])),"2017 or not finished good item",related(DT_Items[Product_Group01]))
I’m using this formula to try to lookup the correct price band: =calculate(values(FT_Tier_Chains[Tier]),filter(FT_Tier_Chains,FT_Sales[Price]>FT_Tier_Chains[Min]&&FT_Sales[Price]<=FT_Tier_Chains[Max]))
That formula pulls the correct band from the FT_Chains banding table but Chains are only one of the many product categories where I need to look up the correct banding by product category.
Can anyone say whether I should have a table for each Product Category banding versus one table with all Categories and their banding?
Can anyone help finish the formula to first look up the banding based on the Product Category?
Thank you so VERY much for any help or thoughts!
") I hope what I ask is ethical on this board. . . I have two pivot table results giving something different than I expect or need. One of the results I've seen many times before and have never been able to find why it's happening. Using MrExcel messages, or I could post the problems, could you help me with them? I would be glad to make a Paypal donation to you for your time. Thank you again for your help with this one!!
I hope what I ask is ethical on this board. . . I have two pivot table results giving something different than I expect or need. One of the results I've seen many times before and have never been able to find why it's happening. Using MrExcel messages, or I could post the problems, could you help me with them? I would be glad to make a Paypal donation to you for your time. Thank you again for your help with this one!!


