didijaba
Well-known Member
- Joined
- Nov 26, 2006
- Messages
- 511
Hi,
I have numerous reports that are generated each day and always have same table like structure. Each row in those reports shows values for unique ID's (like temp1, temp2, temp3, ...). What I need to have as result is table of changes per each ID, field that changed, old value (from most recent previous date) and "new" value. I have no idea how to do this in Power Query, please advice. Sample file is attached
https://ufile.io/j2oc7. This is image of how result should look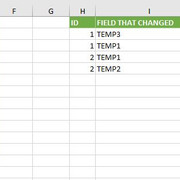
Thanks


