Assistance needed with 5 year sales projection for manufacturing company

jfrancis

New Member
Joined
Nov 7, 2013
Messages
9
Hi everyone, I have recently been asked to make changes to a sales forecast. I've never done a task like this before but I would like to make a 5 year sales projection based on historical data from 2010-2016.

Every company deals with different items, and so, it becomes difficult to follow online tutorials and YouTube videos on how to create a sales forecast. A bit more about my company: we manufacture pipeline products (steel only) and they come in various sizes, grades and thicknesses.

Our selling price greatly depends on the current oil prices (WTI). When the price of oil drops, we make less revenue and vice versa. My current forecast looks like this and I have sales data from 2010 to 2016.

BB50nw3.png


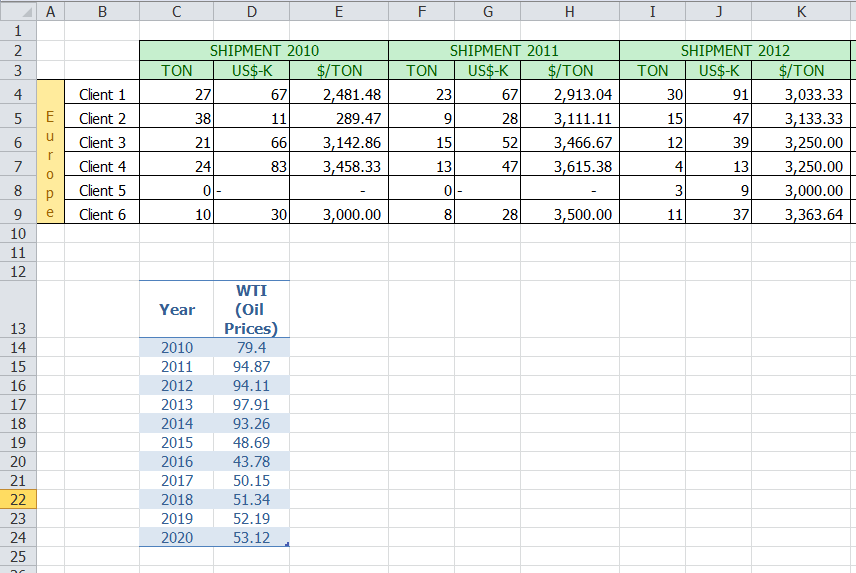
I also have forecast oil prices from 2016 to 2020 and since there is a positive correlation between oil prices and our revenue, I want to prepare a sales projection based on this data. Any help would be appreciated. Can I make a projected revenue graph and table without having to increment each future year by 10%. That approach would merely increase the sales projection without taking into consideration the trends in oil prices.

I currently have the below fields of data:
1. Sales revenue per client (in US$)
2. Sales volume (in metric tons) per client
3. Historical oil prices (2010 - 2016)
4. Forecast oil prices (2016 - 2020)
 

Excel Facts

Do you hate GETPIVOTDATA?
Prevent GETPIVOTDATA. Select inside a PivotTable. In the Analyze tab of the ribbon, open the dropown next to Options and turn it off
Well, at least it's a pretty cool and fun project... if a bit challenging :)

To some degree it is probably going to depend on how fancy you want to get with your predictions. If you want to go all-out, you would be talking Azure ML or R... which integrates pretty well with Power BI (but I am less sure about Excel). But you would be talking about a pretty serious learning curve.

If we are just talking about something a bit more "straight math" like... growth rate is constant 10% then multiplied by N% of oil price... then that is certainly easier. Folks here in the power bi forum will tend to steer you towards power pivot... because it is awesome :) Some learning curve there as well, though -- pretty helpful crew here for that.

If you want to stick to "just straight excel", then you should probably jump to the main excel forum here on mr excel, instead of the power bi one.

Good luck!
 
Upvote 0
Thank you scottsen for your quick reply. I would want to use Power Pivot for this one instead of plain old math formulas. And, as you said, there's a learning curve too, which is always good for me. Since the prices of crude oil steer our revenue to a great extent, I want to use something that takes in this data (historical oil prices) and calculates accordingly. I've taken this data from the U.S. Energy Information Administration (EIA), this data is pretty accurate.

The current sales projection is done by multiplying previous years' revenue by 1.1 and this 10% growth looks good on the sheet, but it's not considering the oil prices. I would like to know how I can use the Analysis ToolPak or Power Pivot to make a more realistic prediction for 2016 - 2020.

P.S. I'm using a company laptop with no admin privileges (can't install software), so I'm unable to dive into R until I want to learn it on my personal PC.
 
Last edited:
Upvote 0
If you aren't going to do fancy machine learning, I would personally just math it up, and import the results as a static table. So, maybe... manually do a linear regression on sales vs oil price, and just use that calculated correlation with future estimates to get a future estimated sales... that I guess you further multiply by some growth factor.

You probably can do this all in power pivot, but I'm not sure its necessary to do the above calcs in power pivot vs once a year and re-import.
 
Upvote 0

Forum statistics

Threads
1,214,414
Messages
6,119,373
Members
448,888
Latest member
Arle8907

We've detected that you are using an adblocker.

We have a great community of people providing Excel help here, but the hosting costs are enormous. You can help keep this site running by allowing ads on MrExcel.com.
Allow Ads at MrExcel

Which adblocker are you using?

Disable AdBlock

Follow these easy steps to disable AdBlock

1)Click on the icon in the browser’s toolbar.
2)Click on the icon in the browser’s toolbar.
2)Click on the "Pause on this site" option.
Go back

Disable AdBlock Plus

Follow these easy steps to disable AdBlock Plus

1)Click on the icon in the browser’s toolbar.
2)Click on the toggle to disable it for "mrexcel.com".
Go back

Disable uBlock Origin

Follow these easy steps to disable uBlock Origin

1)Click on the icon in the browser’s toolbar.
2)Click on the "Power" button.
3)Click on the "Refresh" button.
Go back

Disable uBlock

Follow these easy steps to disable uBlock

1)Click on the icon in the browser’s toolbar.
2)Click on the "Power" button.
3)Click on the "Refresh" button.
Go back
Back
Top