Filter out unique values based on multiple columns using DAX/PowerPivot?

barqers

New Member
Joined
Nov 22, 2016
Messages
7
I know I'm in the Power BI forum, sorry about that, but I wanted to know if it's possible to select unique values only using multiple columns?

Ex. I have a table that has the following columns:
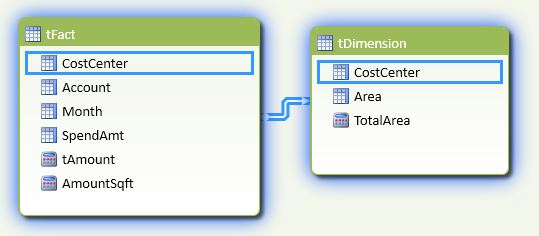
CostCenter# Account# Month# SpendAmt


What happens though is for instance say we have a cost center that does 3 repairs in month 1 there will be 3 rows, that have identical cost centers, account numbers, and month numbers, just the spend amount will be different (usually). However, what I want to do is pull in square footage of the cost center from another table. Problem is if I bring in this data it'll show the square footage 3 times so let's say it's 85,000sqft, when I go to create a powerpivot instead of showing for instance that we have cost center 1, for account 101010, in month 1, we spent $2,000 (in 3 transactions) the square footage will show as 85,000*3 = 255,000. However, if I change the field to an average, I get the correct 85,000, but when I go to create a calculated field of spend amt / square footage, it automatically does $2,000/255,000 instead of the $2,000/85,000. To eliminate this what I want to do in PowerPivot is create a calculated column that brings in the square footage but only once if the cost center, account number, and month are all the same. This will show 85,000 in my pivot using a sum formula, then my calculated field will be $2,000/85,000. Is there a better way?

I've tried Distinct (seems to only work I guess in PowerBI?), rankx (can't seem to get it to show the ranking properly), and summarize but really wasn't sure what to do with all 3. I figured if I could rank based on the 3 criteria, that every rank 1 I would show the square footage. Any ideas? Thank you for the help!
 

Excel Facts

Does the VLOOKUP table have to be sorted?
No! when you are using an exact match, the VLOOKUP table can be in any order. Best-selling items at the top is actually the best.
This sounds like you have pulled the SqFt into your Fact table?

You need two tables:

tFact
Excel 2010
ABCD
1CostCenterAccountMonthSpendAmt
2123445678901/09/20161000
3123445678901/09/2016550
4123445678901/09/2016450
5

<colgroup><col style="width: 25pxpx"><col><col><col><col></colgroup><thead>
</thead><tbody>
</tbody>


tDimension
Excel 2010
GH
1CostCenterArea
2123485000
3

<colgroup><col style="width: 25pxpx"><col><col></colgroup><thead>
</thead><tbody>
</tbody>


Then create 3 measures.

tDimension Measure
TotalArea:=Sum([Area])

tFact Measures
tAmount:=SUM([SpendAmt])
AmountSqft:=tFact[tAmount]/tDimension[TotalArea]

Use CostCentre and AmountSqFt in your pivot.

AmabAZ0.jpg
 
Last edited:
Upvote 0
This sounds like you have pulled the SqFt into your Fact table?

You need two tables:

tFact
Excel 2010
ABCD
1CostCenterAccountMonthSpendAmt
2123445678901/09/20161000
3123445678901/09/2016550
4123445678901/09/2016450
5

<tbody>
</tbody>


tDimension
Excel 2010
GH
1CostCenterArea
2123485000
3

<tbody>
</tbody>


Then create 3 measures.

tDimension Measure
TotalArea:=Sum([Area])

tFact Measures
tAmount:=SUM([SpendAmt])
AmountSqft:=tFact[tAmount]/tDimension[TotalArea]

Use CostCentre and AmountSqFt in your pivot.

AmabAZ0.jpg


Hi Comfy,

I see where you're going with this, but what if for instance there's several accounts aka Rent (1001), Janitorial (1002), Repairs (1003), etc. and also several cost centers Toronto (10) Ottawa (11) and each cost center/account combo will have months 1-12. So we're looking at like 3*2*12=72 rows of data. If I use your method, I seem to be getting the cost/square foot but in total for all 72 rows, but what I want to accomplish is the cost per square footage for each distinct grouping, in this case 2 cost centers * 3 account codes = 6 distinct groupings, aka Cost center 10, account 1001 = $x/sqft. Any thoughts on this?
 
Upvote 0
This should still work (I think, I'm super new to DAX)

It is vital that you use the [CostCenter] field from your Dimension table rather than Fact table.
 
Last edited:
Upvote 0
This should still work (I think, I'm super new to DAX)

It is vital that you use the [CostCenter] field from your Dimension table rather than Fact table.


So when I add tAmount I just get for instance $3,061,128 in every single row, for TotalArea I get let's say 19,677 so in the AmountSqft I just get 15.56 in every row. When I go to a pivot table I'm only using cost center as a slicer, so I end up just seeing 15's everywhere.

I was looking into SUMMARIZE, but it appears you can't create a summarize table in powerpivot?
 
Upvote 0
I don't know I'm afraid.

This is the sample file I was using: Mega File Upload - 977382.xlsx

Hopefully it'll help. As I appear to be getting the correct answers.

Hey Comfy, thank you so much for the file. I would've been stuck forever without it. I didn't realize that a measure goes in the area below the table... I was adding a new column. Oops! Now I know what that area down below is for? Amateur mistake but you solved the solution so eloquently and it took me 3 days to figure out nothing haha. Thanks again!
 
Upvote 0
Hey Comfy, thank you so much for the file. I would've been stuck forever without it. I didn't realize that a measure goes in the area below the table... I was adding a new column. Oops! Now I know what that area down below is for? Amateur mistake but you solved the solution so eloquently and it took me 3 days to figure out nothing haha. Thanks again!

You're very Welcome.
 
Upvote 0
You're very Welcome.

Hey Comfy,

One quick question! Sorry, but say I pull the BIO out of a row label, and instead add the Account # I then get an error saying to create a relationship. I think that's because for instance the tFact table doesn't have a relationship to the tDimension table on the 'Account'. Is there any way around that?
 
Upvote 0
Hey Comfy,

One quick question! Sorry, but say I pull the BIO out of a row label, and instead add the Account # I then get an error saying to create a relationship. I think that's because for instance the tFact table doesn't have a relationship to the tDimension table on the 'Account'. Is there any way around that?

Scratch that sorry, I was using a third table with a list of accounts and their descriptions, but that third table had no relationship to the tDimension table for instance since tDimension doesn't deal with accounts. Instead I just pull in the description from tAccountDescription into tFact as another column and works :)

Thanks again!
 
Upvote 0

Forum statistics

Threads
1,214,606
Messages
6,120,490
Members
448,967
Latest member
visheshkotha

We've detected that you are using an adblocker.

We have a great community of people providing Excel help here, but the hosting costs are enormous. You can help keep this site running by allowing ads on MrExcel.com.
Allow Ads at MrExcel

Which adblocker are you using?

Disable AdBlock

Follow these easy steps to disable AdBlock

1)Click on the icon in the browser’s toolbar.
2)Click on the icon in the browser’s toolbar.
2)Click on the "Pause on this site" option.
Go back

Disable AdBlock Plus

Follow these easy steps to disable AdBlock Plus

1)Click on the icon in the browser’s toolbar.
2)Click on the toggle to disable it for "mrexcel.com".
Go back

Disable uBlock Origin

Follow these easy steps to disable uBlock Origin

1)Click on the icon in the browser’s toolbar.
2)Click on the "Power" button.
3)Click on the "Refresh" button.
Go back

Disable uBlock

Follow these easy steps to disable uBlock

1)Click on the icon in the browser’s toolbar.
2)Click on the "Power" button.
3)Click on the "Refresh" button.
Go back
Back
Top