MS Excel 2013 PowerPivot - Creating a new Calculated Column Field

dluhut

New Member
Joined
Feb 24, 2012
Messages
21
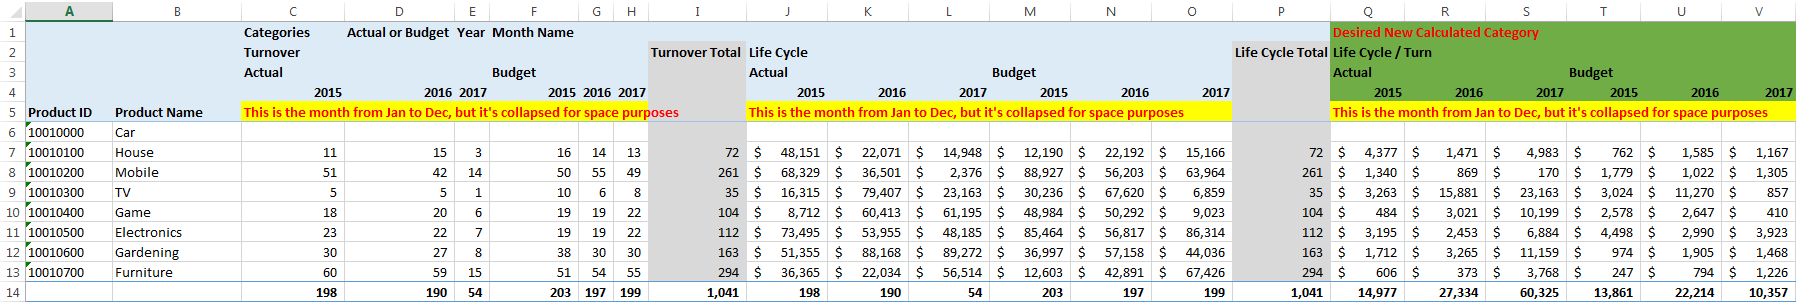
I was able to create a pivot table via PowerPivot as shown below via the classic Pivot Table color (light blue).

Noticed that the columns consist of 'Categories', 'Actual or Budget', 'Year' and 'Month Name'

Thus, for each category (Turnover and Life Cycle), there'll be Actual and Budget, and for each Actual and Budget, there'll be each year (2015 to 2017) and months (from Jan to Dec)

My question is, how can I create a new calculated category, in this case, in this case Life Cycle/Turn (colored in green) in power pivot where it'll know to calcualte for each 'Actual or Budget', 'Year' and 'Month'?


RPXRqXM.png
 

Excel Facts

Waterfall charts in Excel?
Office 365 customers have access to Waterfall charts since late 2016. They were added to Excel 2019.
Do you have measures for life cycle and turn? If not, you should write them first. I don't know your data but let me guess something like this

lifecycle = sum(table[lifecycle])
turnover = sum(table[turnover])
then your new measure

= divide([lifecycle],[turnover])
 
Upvote 0
Do you have measures for life cycle and turn? If not, you should write them first. I don't know your data but let me guess something like this

lifecycle = sum(table[lifecycle])
turnover = sum(table[turnover])
then your new measure

= divide([lifecycle],[turnover])

I don't have measures for life cycle and turn. Those categories (Turnover and Life Cycle) are in different tables.

For clarity purposes, I would have 6 tables.
tbl2015Turnover where I have the Actuals and Budgets for Turnover from Jan-Dec of 2015
tbl2016Turnover where I have the Actuals and Budgets for Turnover from Jan-Dec of 2016
tbl2017Turnover where I have the Actuals and Budgets for Turnover from Jan-Dec of 2017

tbl2015LifeCycle where I have the Actuals and Budgets for LifeCycle from Jan-Dec of 2015
tbl2016LifeCycle where I have the Actuals and Budgets for LifeCycle from Jan-Dec of 2016
tbl2017LifeCycle where I have the Actuals and Budgets for LifeCycle from Jan-Dec of 2017

I have then a dCategory table where I create relationship to each of these tables. In this dCategory tables, I then create a measure [Amount] in order to get the amount for each respective categories, for each Actuals/Budgets, for each Year and for each month. The reason why I create this is so that I can have it appear in 1 row for the same Product ID/Name. If I didn't create it, then my 'amount' will appear diagonally down (see my other post of what i meant by 'diagonnaly down' in this link )
 
Upvote 0

Forum statistics

Threads
1,214,971
Messages
6,122,517
Members
449,088
Latest member
RandomExceller01

We've detected that you are using an adblocker.

We have a great community of people providing Excel help here, but the hosting costs are enormous. You can help keep this site running by allowing ads on MrExcel.com.
Allow Ads at MrExcel

Which adblocker are you using?

Disable AdBlock

Follow these easy steps to disable AdBlock

1)Click on the icon in the browser’s toolbar.
2)Click on the icon in the browser’s toolbar.
2)Click on the "Pause on this site" option.
Go back

Disable AdBlock Plus

Follow these easy steps to disable AdBlock Plus

1)Click on the icon in the browser’s toolbar.
2)Click on the toggle to disable it for "mrexcel.com".
Go back

Disable uBlock Origin

Follow these easy steps to disable uBlock Origin

1)Click on the icon in the browser’s toolbar.
2)Click on the "Power" button.
3)Click on the "Refresh" button.
Go back

Disable uBlock

Follow these easy steps to disable uBlock

1)Click on the icon in the browser’s toolbar.
2)Click on the "Power" button.
3)Click on the "Refresh" button.
Go back
Back
Top