
Mapping Excel Data
August 10, 2005
To try this tip on your own computer, download and unzip CFH259.zip.
Many manager’s eyes glaze over when they are presented with a report full of numbers. If your Excel data has any geographic component, you can use Microsoft MapPoint to plot the data on a map. MapPoint is a separate program that you can buy from Microsoft. The program has a $299 list price, but Microsoft has a habit of making these available to I.T. managers for attending conferences, so you can usually find gently used versions at Amazon for significantly less.
Visualize Your Customer Base
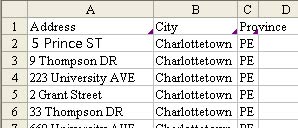
Do you have an Excel mailing list of the customers who shop in your store? Why not see where they live. Start with data in Excel. The data should have headings such as Name, Address, City, Province, Postal Code. You can get buy with a minimum of address, city, and province.
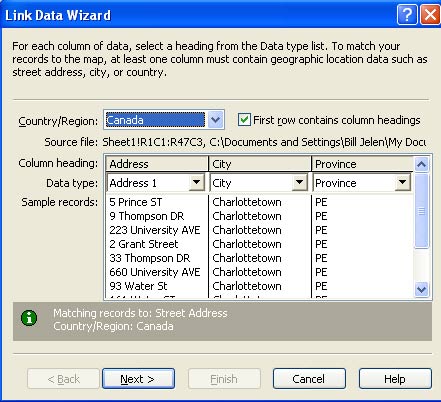
Select your data range (including the headings) and press the MapPoint button on the standard toolbar. In a few seconds, you will be presented with the Link Data Wizard dialog. If necessary, change the country from the United States to Canada.
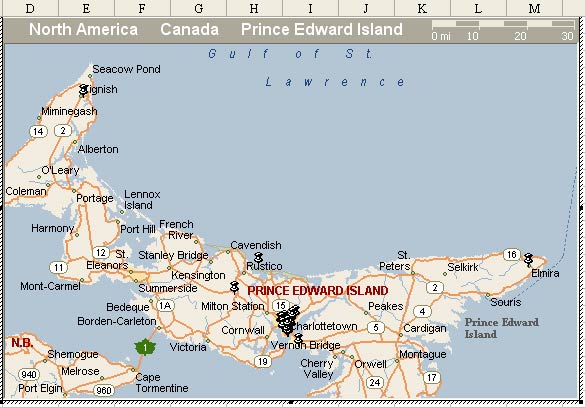
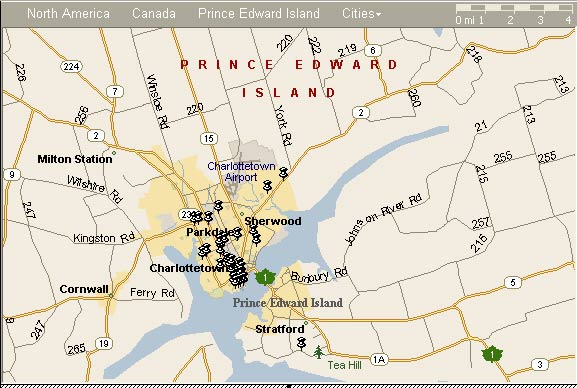
The initial map in Excel will be zoomed in to encompass your records. Initially, we have customers from Tignish to Elmira, so the map is showing all of Prince Edward Island.
While the map is active, Excel displays a MapInfo toolbar. Make sure that the Select icon (to the left of the hand) is active.
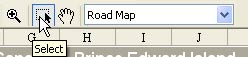
With the select icon, draw a rectangle around the core of your customers.
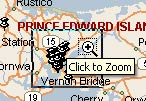
Click inside the rectangle to zoom.
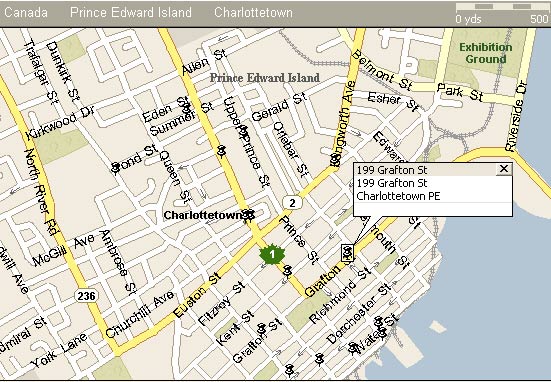
You can keep on zooming for a more detailed view. Double click any pushpin to see the details for that address.
When you click outside of the map, the current zoom level is saved and your map will print with the rest of the Excel document.
Create a Summary Map By Province
In this dataset, you have 1000+ records and would like Excel to sum up a column by province.
For this example, I saved the Excel file to a workbook and opened MapPoint. From MapPoint, I chose Data - Import Data Wizard. Select the proper Excel file and choose Open. In the next screen, specify tht your data is from Canada. If you have useful headings, MapPoint will correctly map them to the right fields. Click Finish.

If there are addresses which are typed wrong, MapPoint will offer you a list of close matches.

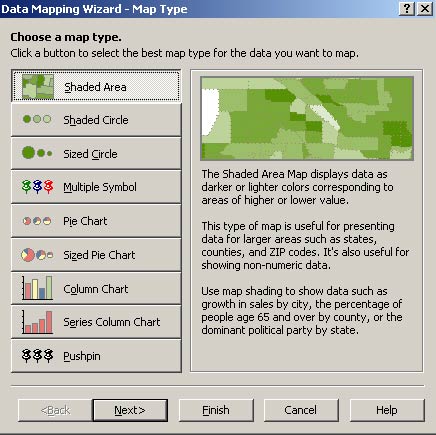
Instead of a pushpin map, use a Shaded Area Map.
On the next screen, choose that you want to add the Patrons data and sum it by province.
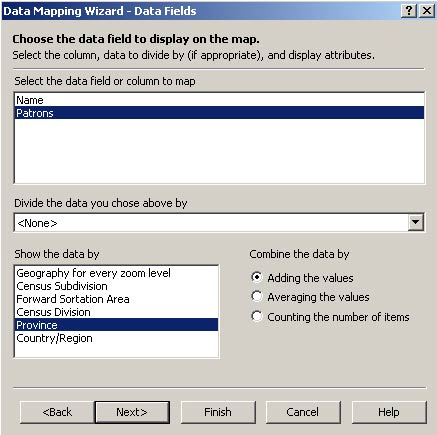
On the final screen, choose a color scheme.

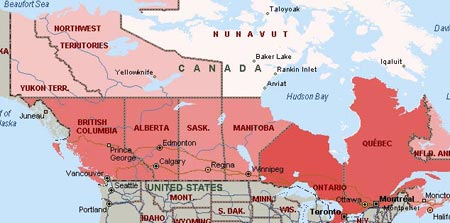
MapPoint will color the provinces. Darker red indicates more patrons and white indicates few patrons.
Driving Directions
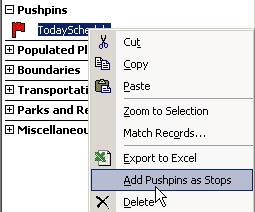
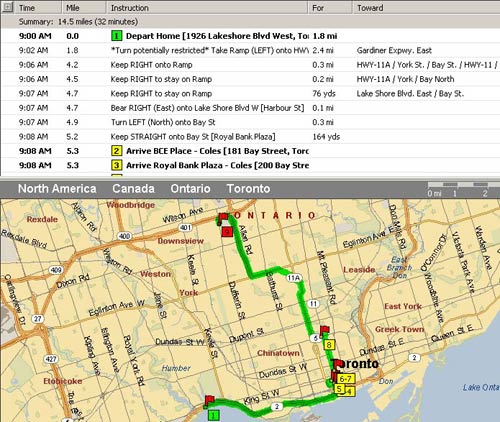
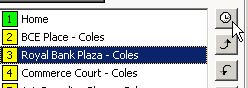
Import an Excel file with your driving itinerary for the day. Include your office as the first or last address. Import this data as pushpins using Data - Import Data Wizard. Once the items are imported, right-click on the pushpin symbol in the Legend and Overview section of the window. From the right-click menu, choose add Pushpins as Stops.
From the main menu, select Route - Route Planner. In the Route Planner pane, choose Calculate Route.
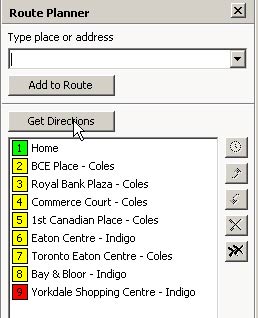
MapPoint will calculate the driving route.
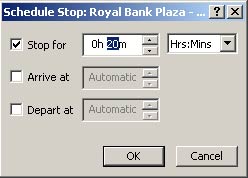
Click on any stop in the Route Planner and choose the clock icon.
You can specify how long you will stop at that customer.
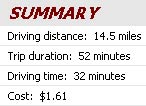
At the bottom of the driving directions, you can see a summary of total driving time, estimated fuel usage, and total elapsed time.
Tip
To make the summary information more useful, change driving speeds and fuel costs in the Route - More Options dialog.