Doug Mutzig
Board Regular
- Joined
- Jan 1, 2019
- Messages
- 57
- Office Version
- 365
- Platform
- Windows
Hi All!
I am trying to figure out a way to calculate staff utilization based on Start Time and Duration or Start and End Time (not sure which will give the better answer).
I have several columns of information in a sample workbook: Tech, Facility, Start (date & time), End (date&time), Start Time (time), End Time (time), Duration, Date.
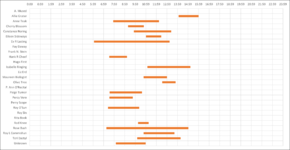
I am trying to first figure out a count of concurrent activities happening per hour, and then per tech's duration how many other activites are happening. I was able to do a chart and then get rough numbers from that but there has to be a way to calculate this. I have 4 different tries from googling and reading through forums with mixed results - Con Test 2 seems to be the closest but doesn't match on all items that I can tell.
My eventual goal is to find out how many concurrent techs in use per facility per day (possibly per hour). I would love to pivot this so that I can have a chart along with it and slicers to adjust (facility, date/time, etc.)
Any help would be much appreciated.
I am trying to figure out a way to calculate staff utilization based on Start Time and Duration or Start and End Time (not sure which will give the better answer).
I have several columns of information in a sample workbook: Tech, Facility, Start (date & time), End (date&time), Start Time (time), End Time (time), Duration, Date.
I am trying to first figure out a count of concurrent activities happening per hour, and then per tech's duration how many other activites are happening. I was able to do a chart and then get rough numbers from that but there has to be a way to calculate this. I have 4 different tries from googling and reading through forums with mixed results - Con Test 2 seems to be the closest but doesn't match on all items that I can tell.
My eventual goal is to find out how many concurrent techs in use per facility per day (possibly per hour). I would love to pivot this so that I can have a chart along with it and slicers to adjust (facility, date/time, etc.)
Any help would be much appreciated.
| Example.xlsx | ||||||||||||||
|---|---|---|---|---|---|---|---|---|---|---|---|---|---|---|
| B | C | D | E | F | G | H | I | J | K | L | M | |||
| 1 | Array | Array | ||||||||||||
| 2 | Tech | Facility | Start | End | Start Time | End Time | Duration | Date | Con Test 1 | Con Test 2 | Con Test 3 | Con Test 4 | ||
| 3 | A. Mused | Maine Medical Center | 4/1/19 0:00 | 4/1/19 0:00 | 0:00 | 0:00 | 0:00 | 4/1/2019 | 1 | 10 | 9 | 1 | ||
| 4 | Allie Grater | Kaiser Sunnybrook | 4/1/19 14:06 | 4/1/19 16:00 | 14:06 | 16:00 | 1:54 | 4/1/2019 | 2 | 5 | 9 | 1 | ||
| 5 | Anne Teak | Cleveland Clinic Akron General | 4/1/19 7:54 | 4/1/19 12:15 | 7:54 | 12:15 | 4:21 | 4/1/2019 | 2 | 17 | 9 | 1 | ||
| 6 | Cherry Blossom | Cleveland Clinic Akron General | 4/1/19 9:19 | 4/1/19 10:49 | 9:19 | 10:49 | 1:30 | 4/1/2019 | 3 | 13 | 9 | 1 | ||
| 7 | Constance Noring | Cleveland Clinic Akron General | 4/1/19 9:52 | 4/1/19 13:24 | 9:52 | 13:24 | 3:32 | 4/1/2019 | 4 | 14 | 9 | 1 | ||
| 8 | Eileen Sideways | Kaiser Sunnyside Medical Center | 4/1/19 11:01 | 4/1/19 12:28 | 11:01 | 12:28 | 1:27 | 4/1/2019 | 4 | 9 | 9 | 1 | ||
| 9 | Ev R Lasting | Parkview Medical Center | 4/1/19 6:05 | 4/1/19 13:15 | 6:05 | 13:15 | 7:10 | 4/1/2019 | 6 | 14 | 9 | 1 | ||
| 10 | Fay Daway | Mercy Medical Center | 4/1/19 0:00 | 4/1/19 0:00 | 0:00 | 0:00 | 0:00 | 4/1/2019 | 1 | 9 | 9 | 1 | ||
| 11 | Frank N. Stein | Crystal Clinic Orthopaedic Center | 4/1/19 0:00 | 4/1/19 0:00 | 0:00 | 0:00 | 0:00 | 4/1/2019 | 1 | 8 | 9 | 1 | ||
| 12 | Hank R Cheef | MercyOne Waterloo Medical Center | 4/1/19 7:32 | 4/1/19 9:13 | 7:32 | 9:13 | 1:41 | 4/1/2019 | 4 | 7 | 9 | 1 | ||
| 13 | Hugo First | Crystal Clinic Orthopaedic Center | 4/1/19 0:00 | 4/1/19 0:00 | 0:00 | 0:00 | 0:00 | 4/1/2019 | 1 | 7 | 9 | 1 | ||
| 14 | Isabelle Ringing | Mercy Medical Center | 4/1/19 11:09 | 4/1/19 15:13 | 11:09 | 15:13 | 4:04 | 4/1/2019 | 7 | 8 | 9 | 1 | ||
| 15 | Liz Erd | Cleveland Clinic Akron General | 4/1/19 0:00 | 4/1/19 0:00 | 0:00 | 0:00 | 0:00 | 4/1/2019 | 1 | 6 | 9 | 1 | ||
| 16 | Maureen Biologist | St Vincent Medical Center - Ear | 4/1/19 10:47 | 4/1/19 13:00 | 10:47 | 13:00 | 2:13 | 4/1/2019 | 8 | 8 | 9 | 1 | ||
| 17 | Olive Tree | Parkview Medical Center | 4/1/19 12:33 | 4/1/19 13:49 | 12:33 | 13:49 | 1:16 | 4/1/2019 | 6 | 5 | 9 | 1 | ||
| 18 | P. Ann O'Recital | Methodist Le Bonheur Germantown Hospital | 4/1/19 0:00 | 4/1/19 0:00 | 0:00 | 0:00 | 0:00 | 4/1/2019 | 1 | 5 | 9 | 1 | ||
| 19 | Paige Turner | Methodist Le Bonheur Germantown Hospital | 4/1/19 7:34 | 4/1/19 10:38 | 7:34 | 10:38 | 3:04 | 4/1/2019 | 7 | 8 | 9 | 1 | ||
| 20 | Percy Vere | Methodist Le Bonheur Germantown Hospital | 4/1/19 7:33 | 4/1/19 9:46 | 7:33 | 9:46 | 2:13 | 4/1/2019 | 7 | 5 | 9 | 1 | ||
| 21 | Perry Scope | White Memorial Medical Center | 4/1/19 0:00 | 4/1/19 0:00 | 0:00 | 0:00 | 0:00 | 4/1/2019 | 1 | 4 | 9 | 1 | ||
| 22 | Ray O'Sun | Le Bonheur Children's Medical Center | 4/1/19 7:25 | 4/1/19 10:22 | 7:25 | 10:22 | 2:57 | 4/1/2019 | 9 | 6 | 9 | 1 | ||
| 23 | Ray Sin | Summa Akron City | 4/1/19 0:00 | 4/1/19 0:00 | 0:00 | 0:00 | 0:00 | 4/1/2019 | 1 | 3 | 9 | 1 | ||
| 24 | Rita Book | Maine Medical Center | 4/1/19 0:00 | 4/1/19 0:00 | 0:00 | 0:00 | 0:00 | 4/1/2019 | 1 | 2 | 9 | 1 | ||
| 25 | Rod Knee | St. Patrick Hospital | 4/1/19 10:16 | 4/1/19 11:16 | 10:16 | 11:16 | 1:00 | 4/1/2019 | 11 | 6 | 9 | 1 | ||
| 26 | Rose Bush | St. Patrick Hospital | 4/1/19 7:16 | 4/1/19 15:02 | 7:16 | 15:02 | 7:46 | 4/1/2019 | 16 | 5 | 9 | 1 | ||
| 27 | Roy L Commishun | St. Patrick Hospital | 4/1/19 10:47 | 4/1/19 13:43 | 10:47 | 13:43 | 2:56 | 4/1/2019 | 12 | 4 | 9 | 1 | ||
| 28 | Teri Dactyl | Maine Medical Center | 4/1/19 10:11 | 4/1/19 14:18 | 10:11 | 14:18 | 4:07 | 4/1/2019 | 16 | 3 | 9 | 1 | ||
| 29 | Unknown | Kaiser Sunnyside Medical Center | 4/1/19 8:10 | 4/1/19 10:59 | 8:10 | 10:59 | 2:49 | 4/1/2019 | 15 | 2 | 9 | 1 | ||
Sheet2 (3) | ||||||||||||||
| Cell Formulas | ||
|---|---|---|
| Range | Formula | |
| F3:F29 | F3 | =NUMBERVALUE(TEXT([@Start],"h:mm")) |
| G3:G29 | G3 | =NUMBERVALUE(TEXT([@End],"h:mm")) |
| H3:H29 | H3 | =IF([@End]>=[@Start],[@End]-[@Start],[@End]+1-[@Start]) |
| I3:I29 | I3 | =NUMBERVALUE(TEXT([@Start],"mm/dd/yyyy")) |
| J3:J29 | J3 | =COUNTIFS(D$2:D3,"<"&E3,E$2:E3,">"&D3)+1 |
| K3:K29 | K3 | =COUNTIFS(F3:F$29,"<="&G3,G3:G$29,">="&F3)+1 |
| L3:L29 | L3 | =SUM(IF(FREQUENCY(IF(F$3:F29<=F3,IF(G$3:G29>=F3,MATCH(B$3:B$29,B$3:B$29,0))),ROW(B$3:B$29)-ROW(B$3)+1),1)) |
| M3:M29 | M3 | =MAX(MAX(COUNTIFS(T_Data245[@[Start Time]],"<="&T_Data245[@[Start Time]],T_Data245[@[End Time]],">="&T_Data245[@[Start Time]])),MAX(COUNTIFS(T_Data245[@[Start Time]],"<="&T_Data245[@[End Time]],T_Data245[@[End Time]],">="&T_Data245[@[End Time]]))) |
| Press CTRL+SHIFT+ENTER to enter array formulas. | ||
| Cells with Conditional Formatting | ||||
|---|---|---|---|---|
| Cell | Condition | Cell Format | Stop If True | |
| E3:E74 | Expression | =E3<D3 | text | NO |