I am trying to make an area chart in Excel that shows the overlap between the two data series in a third color, a sort of translucent color so you can see where the otherwise hidden series is (like tracing paper).
This is what my graph looks like
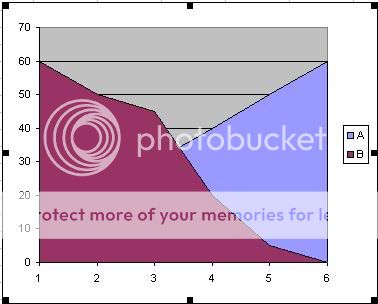
I know I can just say "None" so the one series won't have a fill and you will just see the line going through, but I really want it to look translucent, so the color under and the line, or at least the line, shines through the top color.
Any ideas??
This is what my graph looks like
I know I can just say "None" so the one series won't have a fill and you will just see the line going through, but I really want it to look translucent, so the color under and the line, or at least the line, shines through the top color.
Any ideas??


