Please HELP!!!! before I throw the computer out the window

bstraw

New Member
Joined
Sep 8, 2008
Messages
17
Hello all, New to this site but it looks like someone may be able to help, and I am so frustrated now I really need help. OK here is the question. I am making an xy scatter graph. I have 3000+ data points to get the line that I need. Now I want to add a symbol to one of the 3000+data points so it shows up, and also add a label to it. For simplicity sake lets say I have data in two columns, A and B, with 200 rows. I insert a xy scatter and it gives me a nice straight line. Now I want to select the data in Row 184 to show up as a point on the nice line in the graph, can this be done? AHHHHH please help
Thanks in advance
 

Excel Facts

Who is Mr Spreadsheet?
Author John Walkenbach was Mr Spreadsheet until his retirement in June 2019.
So you have 200 rows, but row 184 is not showing up? That doesn't really make sense.

A screenshot of what you want would help.
 
Upvote 0
I think they mean they are wanting to isolate a point along the line and change the symbol for that point and provide a label for it.
 
Upvote 0
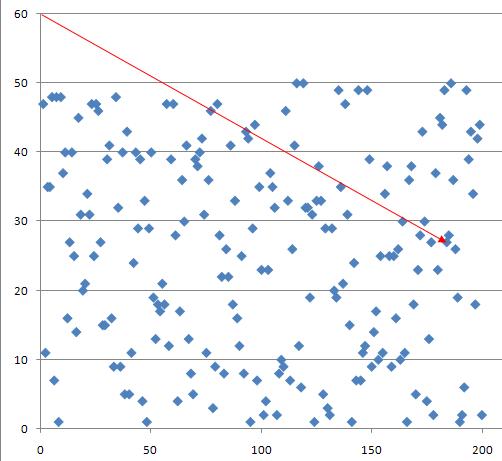
Maybe like this. I adapted a macro from Professional Excel Development samples. It takes the first chart on the active sheet, and points an arrow to its point #184, like so:

PointToPoint.jpg


This is the code that did it:

Rich (BB code):
Public Sub HighlightPoint()
    Dim rngActive As Range
    Dim dXVal As Double
    Dim dYVal As Double
    Dim chtChart As Chart
 
    Dim sh As Excel.Worksheet
    Set sh = Application.ActiveSheet
 
    Dim shp As Excel.Shape
    Set rngActive = ActiveCell
    'We have to activate the chart to use GET.CHART.ITEM
    sh.ChartObjects(1).Activate
 
    'Find the XY position of the middle-top of the third column in the data series,
    'returned in XLM coordinates
    ' change 184 to whatever point # you need
    dXVal = ExecuteExcel4Macro("GET.CHART.ITEM(1,2,""S1P184"")")
    dYVal = ExecuteExcel4Macro("GET.CHART.ITEM(2,2,""S1P184"")")
    'Get the Chart (wherever it is in your case)
    Set chtChart = sh.ChartObjects(1).Chart
    With chtChart
        'Convert the XLM coordinates to Drawing Object coordinates
        'The x values are the same, but the Y values need to be flipped
        dYVal = .ChartArea.Height - dYVal
        'Move and size the Arrow
        Set shp = .Shapes.AddLine(.PlotArea.InsideLeft, .PlotArea.InsideTop, _
                .PlotArea.InsideLeft - 1, .PlotArea.InsideTop - 1)
 
        ' point the arrow to your data point
        shp.Left = .PlotArea.InsideLeft
        shp.Top = .PlotArea.InsideTop
        shp.Width = dXVal - shp.Left
        shp.Height = dYVal - shp.Top
 
        ' format the shape as desired
        shp.Line.ForeColor.RGB = RGB(255, 0, 0)
        shp.Line.BeginArrowheadStyle = Office.msoArrowheadTriangle
    End With
    rngActive.Activate
End Sub

I left in the authors' original comments and added a few specific to your situation.
 
Upvote 0
I guess It would be easier if I could just highlight a cell and it would take me to that point on the graph , then I could just format that point. The problem is that I have so many data points that all of the numbers look like a big black blob on the screen, and trying to choose the specific one is next to impossible, I even taped the mouse down to make the chart large enough to see the numbers, that did not go over well, ha. I just want to click on my data and edit that point on the chart, arhhhhh
 
Upvote 0
You could probably adapt that code to do what you want. I'm not very good at coding charts, drawing objects, etc - wish that I could help more with this.
 
Upvote 0
I really appreciate your help but manipulating codes to me is like trying to have a frog fix my transmission, I am completely incompetent when it comes to this stuff, any other ideas would be great.
 
Upvote 0
Okay well sure, I'll give it a shot. You want to select a point in your data, and have that point highlighted how? Circled, arrow like in Bullen/Bovey/Green example, some other kind of label?

Also, is your chart in a worksheet or a separate chart sheet?
 
Upvote 0
If your chart is on the same sheet, then code like this should work. Right-click the data sheet tab, choose View code and then paste this in, adjusting the range to monitor as required:
Code:
Private Sub Worksheet_SelectionChange(ByVal Target As Range)
    Dim n As Long
    ' adjust range to be monitored
    If Not Intersect(Target, Me.Range("A2:B200")) Is Nothing Then
        ' assumes one data series
        With Me.ChartObjects(1).Chart.SeriesCollection(1)
            With Application
                .ScreenUpdating = False
                .EnableEvents = False
                .Calculation = xlCalculationManual
            End With
            For n = 1 To .Points.Count
                With .Points(n)
                    If n = Target.Row - 1 Then
                        .HasDataLabel = True
                        .DataLabel.Text = "it's me!"
                        .MarkerBackgroundColorIndex = 3
                    Else
                        If .HasDataLabel Then .HasDataLabel = False
                        If .MarkerBackgroundColorIndex <> xlColorIndexAutomatic Then _
                            .MarkerBackgroundColorIndex = xlColorIndexAutomatic
                    End If
                End With
            Next n
            With Application
                .Calculation = xlCalculationAutomatic
                .EnableEvents = True
                .ScreenUpdating = True
            End With
        End With
    End If
End Sub

HTH
 
Upvote 0

Forum statistics

Threads
1,215,011
Messages
6,122,677
Members
449,092
Latest member
tayo4dgacorbanget

We've detected that you are using an adblocker.

We have a great community of people providing Excel help here, but the hosting costs are enormous. You can help keep this site running by allowing ads on MrExcel.com.
Allow Ads at MrExcel

Which adblocker are you using?

Disable AdBlock

Follow these easy steps to disable AdBlock

1)Click on the icon in the browser’s toolbar.
2)Click on the icon in the browser’s toolbar.
2)Click on the "Pause on this site" option.
Go back

Disable AdBlock Plus

Follow these easy steps to disable AdBlock Plus

1)Click on the icon in the browser’s toolbar.
2)Click on the toggle to disable it for "mrexcel.com".
Go back

Disable uBlock Origin

Follow these easy steps to disable uBlock Origin

1)Click on the icon in the browser’s toolbar.
2)Click on the "Power" button.
3)Click on the "Refresh" button.
Go back

Disable uBlock

Follow these easy steps to disable uBlock

1)Click on the icon in the browser’s toolbar.
2)Click on the "Power" button.
3)Click on the "Refresh" button.
Go back
Back
Top