Statistical Significance

dpmaki

Board Regular
Joined
Sep 12, 2011
Messages
165
Hi all - I'm putting together some data for a coworker of mine based on "Minutes to Customer" and "Number of Customers" for the month.


I've graphed the data to show Sun-Sat and the graph is based on "minutes to customer" and then at the top of each bar I have the number of customers that person dealt with that day.


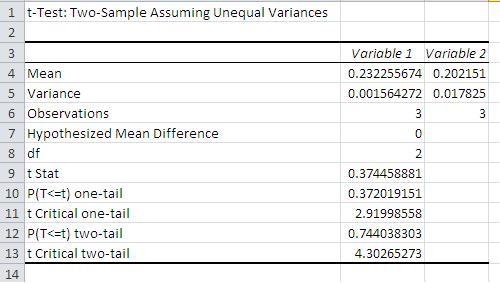
I'd like to do some comparisons of prior month to current month to see if efficiency improved/decreased.


I thought the best way to do that was taking the average number of minutes for the month and dividing that by the total number of customers to give me a percentage - and then comparing that percentage to the prior month. I was talking with another co-worker and they suggested using Statistical Significance. I have to be honest - it's been ages since I took Statistics and a couple google searches didn't overturn anything useful. I'm hoping someone here has some experience with this or can make another suggestion.


Thanks for your time.
 

Excel Facts

Formula for Yesterday
Name Manager, New Name. Yesterday =TODAY()-1. OK. Then, use =YESTERDAY in any cell. Tomorrow could be =TODAY()+1.
I think what your coworker is getting at is that not all changes in data are significant. Real world data is "noisy"--there are expected variations that should be taken into account.

The idea behind your analysis, if I understand correctly, is to gather metrics to track efficiency in customer calls. You are defining your efficiency metric as Total Minutes divided by Total Customers.

This is all well and good, so long as you understand how this value can fluctuate on a monthly basis without a significant difference in efficiency. In other words, what is "normal"? That's a difficult question to answer, of course, but you need to pick something.

It might be useful to pull an entire year of data of this sort, and consider that overall average to be the baseline. Take a look at each month within that year. What is the variation? How high over the average is the maximum, and how low under that baseline is the minimum? That gives you an idea of what kind of variation you can expect.

Then, compare each new month to that same baseline over the course of a year. How does it compare? Is there a trend? Instead of comparing each month to the one before, comparing to a static baseline allows you to see if your numbers are trending up or down.

If there is a clear trend in place, then you might want to take action. When you do implement an action plan, calculate a new baseline ending the period before the action went into effect. Then, track against that baseline to measure whether your action plan is affecting your metric.

I hope that shed a little light on your question!
 
Upvote 0
significant testing should show up in a google search, and provide websites, where you can input some data , and also excel templates you can use to test if the change in the results you have are significant or not.
Also within a call centre, as already mentioned by ShawnPCooke you would also have to factor out any seasonality changes or any events that would impact the call centre volumes.
and so an annual baseline or longer maybe useful - factoring in those changes
 
Upvote 0
Hi folks - thank you for all your replies. I've been using the data analysis plug in a bit and have come up with the following scenario that I'd like to share.

Looking at one month for one worker who works Tuesday, Thursday and Saturday.


Tuesday: Avg Time: 99.40
# of Calls: 25


Thursday: Avg Time: 160.63
# of Calls: 30


Saturday: Avg Time: 81.24
# of Calls: 21


Prior Month:


Tuesday: Avg Time: 69.33
# of Calls: 9


Thursday: Avg Time: 81.41
# of Calls: 29


Saturday: Avg Time: 57.78
# of Calls: 32


What is considered good is low avg time + higher number of calls
So - what I'm doing from here is dividing the # of calls by avg time to get a percentage.


For Current Month I have: 25%, 19% and 26%
For Previous Month I have: 13%, 36% and 12%


The higher the percentage the better the worker is doing. I'm plugging those numbers into the Data Analysis "t-test: Two-Sample Assuming Unequal Variance". Current Month range is going into the Variable 1 Range, and previous month range is going into the Variable 2 range. I'm putting hypotesized mean difference at 0 and I'm setting alpha to 0.05.


This is where I'm getting confused as to whether the data would be considered insignificant or not, or whether or not I'm using the data analysis tool correctly.


This is the t-test results:

Z4Arjwk.jpg


Thanks for any input.
 
Upvote 0
Hi,
From a statistical perspective, there are a lot of "challenges" (opportunities for improvement? :) ) with the scenario as presented, so I have some questions.
How was the "average minutes to customer" derived? Is that a number that's already provided from some report? I assumed that it was the total work time that day of the week (for the whole month) divided by the number of calls that were handled. If that's the case, then the number of calls are already part of the calculation, so dividing by that number again will not be meaningful. If it's something else, I would be able to provide better help if I knew how it was generated.
You've stated a couple of times that you're dividing by number of calls to get a percentage. Percentage of what? Percent indicates a part of a whole, such that if all of the percentages are available, the total will be 100% (give or take, depending on rounding).
Are the specific days of the week significant? Do you expect a different number of calls, or a different number of minutes per call, on different days of the week? If so, a better statistical analysis would use a Paired-t test.
Based on the analysis you showed above, however, (and I'm not convinced yet that the numbers you compared are meaningful) the results do not show a statistically significant difference, assuming a required significance level of 0.05. What you would expect if the numbers were statistically significantly different is that the p-value shown would be less than 0.05.
Hope that helps a bit,
 
Upvote 0

Forum statistics

Threads
1,215,054
Messages
6,122,895
Members
449,097
Latest member
dbomb1414

We've detected that you are using an adblocker.

We have a great community of people providing Excel help here, but the hosting costs are enormous. You can help keep this site running by allowing ads on MrExcel.com.
Allow Ads at MrExcel

Which adblocker are you using?

Disable AdBlock

Follow these easy steps to disable AdBlock

1)Click on the icon in the browser’s toolbar.
2)Click on the icon in the browser’s toolbar.
2)Click on the "Pause on this site" option.
Go back

Disable AdBlock Plus

Follow these easy steps to disable AdBlock Plus

1)Click on the icon in the browser’s toolbar.
2)Click on the toggle to disable it for "mrexcel.com".
Go back

Disable uBlock Origin

Follow these easy steps to disable uBlock Origin

1)Click on the icon in the browser’s toolbar.
2)Click on the "Power" button.
3)Click on the "Refresh" button.
Go back

Disable uBlock

Follow these easy steps to disable uBlock

1)Click on the icon in the browser’s toolbar.
2)Click on the "Power" button.
3)Click on the "Refresh" button.
Go back
Back
Top