Stock chart with std dev plot

novice198

New Member
Joined
Jul 13, 2016
Messages
7
Hi,
I would like to plot a chart in excel as under:-
Stock price with Date ( I have this data and plotted the data)
Plot regression trend line ( have done this also)
Plot a line one std dev above and another std dev below the regression line ( dont know how to do this)
Plot a line 2 std dev above and another std dev below the regression line ( dont know how to do this)
Can someone pls help me with this.
Thanks in advance
Novice198
 

Excel Facts

Why are there 1,048,576 rows in Excel?
The Excel team increased the size of the grid in 2007. There are 2^20 rows and 2^14 columns for a total of 17 billion cells.
Your Trend ± StdDev lines have to each be added to the chart as separate series. I'll assume you used a linear trend line in what you have graphed so far. Linear trend lines have formulas that are of the form y = mx + b, where m is the slope and b is the y-intercept. Your price is the y in the equation,the day is the x.

Did you check the option to 'Display equation on chart'? That would give you the equation you could use to create formulas for the other parallel series. Or you can use the Excel function LINEST to calculate the slope and the intercept. Note that LINEST is an array function, that must be entered using Ctrl+Shift+Enter, not simply enter. As I've used it in the example below, I selected the two cells, A2 and B2, and while they were both selected, typed the formula and then pressed Ctrl+Shift+Enter.

The six series to plot are in columns C through H.


Excel 2012
ABCDEFGH
1SlopeIntercept
20.42142918.94167
3
4DateDayPriceLinTrendLinT-2SDLinT-1SDLinT+1SDLinT+2SD
531-May119.1319.3617.1918.2720.4521.54
61-Jun219.5019.7817.6118.7020.8721.96
72-Jun320.0020.2118.0319.1221.2922.38
83-Jun422.0020.6318.4519.5421.7222.80
96-Jun521.2521.0518.8719.9622.1423.23
107-Jun620.6321.4719.2920.3822.5623.65
Sheet1
Cell Formulas
RangeFormula
D5=$A$2 * B5 + $B$2
E5=D5 - 2 * STDEV.S($C$5:$C$10)
F5=D5 - STDEV.S($C$5:$C$10)
G5=D5 + STDEV.S($C$5:$C$10)
H5=D5 + 2 * STDEV.S($C$5:$C$10)
A2:B2{=LINEST($C$5:$C$10,$B$5:$B$10)}
Press CTRL+SHIFT+ENTER to enter array formulas.
 
Upvote 0
Your Trend ± StdDev lines have to each be added to the chart as separate series. I'll assume you used a linear trend line in what you have graphed so far. Linear trend lines have formulas that are of the form y = mx + b, where m is the slope and b is the y-intercept. Your price is the y in the equation,the day is the x.

Thanks for the swift response. However, I have not been able to achieve what I wanted.
I am attaching the file with the raw data and the another file with the desired Chart. I would appreciate if you have a look at same and then guide me.

How can I attach a file here.


Cheers
Novice
 
Upvote 0
You cannot attach files on this forum. See http://www.mrexcel.com/forum/board-announcements/127080-guidelines-forum-use.html.

You can upload a file to a public folder on Dropbox or Box.com or a similar file sharing service and give a link to the file in your post. Many forum users will not download a file.

You also can't attach images directly. you have to use a public image posting service. You can us BBCode so that an image will appear in the post. Note that many companies filter these image links out and other users won't see anything. Here's the chart I made (I can't see this image when I'm at work):

Ddzw4Sk.png


Can you find a chart similar to what you want by Googling and then post a link to that image here?
 
Upvote 0
You cannot attach files on this forum. See http://www.mrexcel.com/forum/board-announcements/127080-guidelines-forum-use.html.

You can upload a file to a public folder on Dropbox or Box.com or a similar file sharing service and give a link to the file in your post. Many forum users will not download a file.

You also can't attach images directly. you have to use a public image posting service. You can us BBCode so that an image will appear in the post. Note that many companies filter these image links out and other users won't see anything. Here's the chart I made (I can't see this image when I'm at work):


Can you find a chart similar to what you want by Googling and then post a link to that image here?

Thanks for the swift response. Your chart looks like what should be the end result which I am looking for.
CzUDCWk]

The above is what I have plotted.
The chart which I want is as per below
0ZDC9yP]


I hope you are able to see the charts

cheers
novice
 
Upvote 0
OK, the graph you want is similar to what I posted previously. I downloaded the data from Yahoo!Finance, eliminated all columns except for the date and closing price column. Here's a tiny excerpt. There are two columns of 345 rows. I then sorted the data from oldest to newest.

AB
1DateClose
21987-12-28823.2
31988-01-04908.9
41988-02-01888.8
51988-03-01925.8

<tbody>
</tbody>

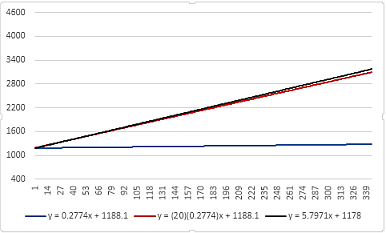
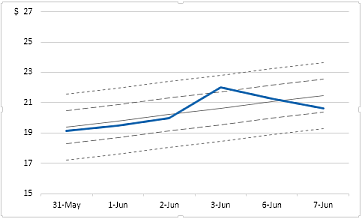
The first step is to select only B1:B345. Do not select the date column. Then insert a line chart. The x-axis labels should be a series of increasing numbers, not dates. Now insert a linear trendline and make sure the trendline equation is displayed. The equation should be very close to: y = 5.7971x + 1178. To be like the example chart format the trendline to be small red plus signs (dots?).

Use column C as a helper column. Fill the column from C2 downward with the numbers from 1 to 344. You can use either Home >> Fill >> Series from the menu bar or use a formula.

The lines parallel to the trendline appear to be set at ±1.0 and ±1.5 times the standard deviation. These are calculated in columns D through F as shown below. The formulas in row 2 are copied downward.


Excel 2012
ABCDEFG
1DateCloseHelperTr-1.5*StDevTr-1*StDevTr+1*StDevTr+1.5*StDev
21987-12-28823.21104.4102464.20581903.3882263.184
31988-01-04908.92110.2073470.00291909.1852268.981
41988-02-01888.83116.0044475.81914.9832274.778
51988-03-01925.84121.8015481.59711920.782280.575
monthly_sti_index
Cell Formulas
RangeFormula
D2=5.7971 * C2 + 1178 - 1.5 * STDEV.S($B$2:$B$345)
E2=5.7971 * C2 + 1178 - STDEV.S($B$2:$B$345)
F2=5.7971 * C2 + 1178 + STDEV.S($B$2:$B$345)
G2=5.7971 * C2 + 1178 + 1.5 * STDEV.S($B$2:$B$345)


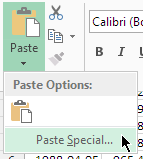
Select D1:G345 and copy the cells. Then select the chart. With the chart selected, go to the Home tab on the ribbon. Under the Clipboard Paste icon is a small downward pointing triangle. Click the triangle, then select "Paste Special".

Tt0h8X4.png


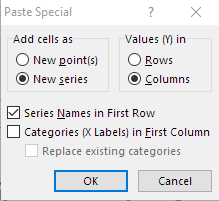
In the dialog box that pops up, select "New Series", "Columns", "Series Names in First Row" and then press "OK",

1yriKpi.png


The standard deviation lines should appear in the chart.

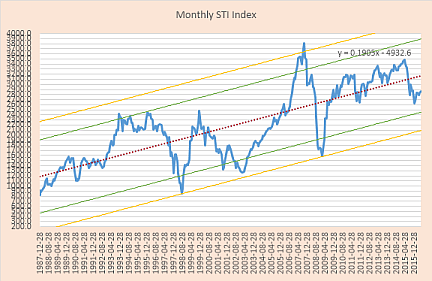
Now we'll make the x-axis show dates instead of numbers. Select the chart and right-click to bring up the pop-up menu. Choose "Select data". In the dialog box that pops up, click on the right-hand "Edit" button. In the "Axis Labels" dialog box, enter "A2:A345". Press "OK" in that dialog box, then press "OK" in the "Select Data Source" dialog box and you should be returned to your chart, now showing dates on the x-axis.

The remainder is just formatting. The chart area is a light orange; the plot area is white; the y-axis is set to run from 200 to 4000 with 100 points as the interval; the x-axis has an 8-month interval; and so on. Too busy for my taste but it matches your example.

KMhxj5v.png
 
Last edited:
Upvote 0
OK, the graph you want is similar to what I posted previously. I downloaded the data from Yahoo!Finance, eliminated all columns except for the date and closing price column. Here's a tiny excerpt. There are two columns of 345 rows. I then sorted the data from oldest to newest.


<tbody>
</tbody>
The first step is to select only B1:B345. The equation should be very close to: y = 5.7971x + 1178. To be like the example chart format the trendline to be small red plus signs (dots?).


The lines parallel to the trendline appear to be set at ±1.0 and ±1.5 times the standard deviation. These are calculated in columns D through F as shown below. The formulas in row 2 are copied downward.

Excel 2012
monthly_sti_index

Worksheet Formulas
CellFormula
D2=5.7971 * C2 + 1178 - 1.5 * STDEV.S($B$2:$B$345)
E2=5.7971 * C2 + 1178 - STDEV.S($B$2:$B$345)
F2=5.7971 * C2 + 1178 + STDEV.S($B$2:$B$345)
G2=5.7971 * C2 + 1178 + 1.5 * STDEV.S($B$2:$B$345)

<thead>
</thead><tbody>
</tbody>

<tbody>
</tbody>


Too busy for my taste but it matches your example.

KMhxj5v.png

Thanks for the detailed explanantion. Though I have been able to prepare the chart that I wanted i could not get the equation as above. My equation had slope of 0.2774 and intercept as 1188.1. I used your previous example to calculate the LinTrend and then the STD points for the 4 lines. I am still interested to know how you managed to get the above numbers for the equation. Here is the final chart

ABlwhAa.png
[/IMG]

Thanks a ton for all the help. I really appreciate your efforts.
Cheers
novice
 
Upvote 0
Thanks for the detailed explanantion. Though I have been able to prepare the chart that I wanted i could not get the equation as above. My equation had slope of 0.2774 and intercept as 1188.1. I used your previous example to calculate the LinTrend and then the STD points for the 4 lines. I am still interested to know how you managed to get the above numbers for the equation. Here is the final chart

The slope and intercept were from the trendline equation. I had the chart as first displayed, with just the line graph and the x-axis as numbers not dates. I added the trendline and then immediately checked the option to display the trendline equation on the chart. The equation I posted was a direct copy from the equation's textbox.

Your calculated slope is almost exactly one-twentieth of the slope I used. Here's a comparison of the trendlines: yours, yours with the slope multiplied by twenty, and mine.
g2tjLZ0.png


What exactly was your LINEST equation? Was it entered as an array equation, two side-by-side cells selected when you pressed Ctrl+Shift+Enter? The same number of cells for the known_x's as the number of known_y's?
 
Upvote 0
The slope and intercept were from the trendline equation. I had the chart as first displayed, with just the line graph and the x-axis as numbers not dates. I added the trendline and then immediately checked the option to display the trendline equation on the chart. The equation I posted was a direct copy from the equation's textbox.

Your calculated slope is almost exactly one-twentieth of the slope I used. Here's a comparison of the trendlines: yours, yours with the slope multiplied by twenty, and mine.
g2tjLZ0.png


What exactly was your LINEST equation? Was it entered as an array equation, two side-by-side cells selected when you pressed Ctrl+Shift+Enter? The same number of cells for the known_x's as the number of known_y's?

I plotted the Close price first as under
NdHoHuT.png
[/IMG]
Then I added the linear Trendline and got the equation as under:-

y2rw1K8.png
[/IMG]

Then I followed the calculation from your first post
The formulas are as per below:-
lY0ESyT.png
[/IMG]

Finally I have got what I wanted but I am still clueless as o how you for the slope as 5.9.... which kindly explain.
Cheers
novice
 
Upvote 0

Forum statistics

Threads
1,215,227
Messages
6,123,745
Members
449,116
Latest member
alexlomt

We've detected that you are using an adblocker.

We have a great community of people providing Excel help here, but the hosting costs are enormous. You can help keep this site running by allowing ads on MrExcel.com.
Allow Ads at MrExcel

Which adblocker are you using?

Disable AdBlock

Follow these easy steps to disable AdBlock

1)Click on the icon in the browser’s toolbar.
2)Click on the icon in the browser’s toolbar.
2)Click on the "Pause on this site" option.
Go back

Disable AdBlock Plus

Follow these easy steps to disable AdBlock Plus

1)Click on the icon in the browser’s toolbar.
2)Click on the toggle to disable it for "mrexcel.com".
Go back

Disable uBlock Origin

Follow these easy steps to disable uBlock Origin

1)Click on the icon in the browser’s toolbar.
2)Click on the "Power" button.
3)Click on the "Refresh" button.
Go back

Disable uBlock

Follow these easy steps to disable uBlock

1)Click on the icon in the browser’s toolbar.
2)Click on the "Power" button.
3)Click on the "Refresh" button.
Go back
Back
Top