Creating Gantt Chart

dwscrippler

New Member
Joined
Sep 20, 2023
Messages
1
Office Version
  1. 365
Platform
  1. Windows
Good morning,

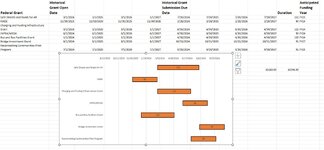
I am attempting to create a long-range grants timeline that will show application windows for a series of grants over a three year period. I would like for each grant to only take up one bar on the chart, if that is possible. I have attached an image of my data and the basic chart I was able to create. Any help is appreciated.
 

Attachments

  • Timeline.JPG
    Timeline.JPG
    153.2 KB · Views: 9

Excel Facts

Using Function Arguments with nested formulas
If writing INDEX in Func. Arguments, type MATCH(. Use the mouse to click inside MATCH in the formula bar. Dialog switches to MATCH.

Forum statistics

Threads
1,215,519
Messages
6,125,294
Members
449,218
Latest member
Excel Master

We've detected that you are using an adblocker.

We have a great community of people providing Excel help here, but the hosting costs are enormous. You can help keep this site running by allowing ads on MrExcel.com.
Allow Ads at MrExcel

Which adblocker are you using?

Disable AdBlock

Follow these easy steps to disable AdBlock

1)Click on the icon in the browser’s toolbar.
2)Click on the icon in the browser’s toolbar.
2)Click on the "Pause on this site" option.
Go back

Disable AdBlock Plus

Follow these easy steps to disable AdBlock Plus

1)Click on the icon in the browser’s toolbar.
2)Click on the toggle to disable it for "mrexcel.com".
Go back

Disable uBlock Origin

Follow these easy steps to disable uBlock Origin

1)Click on the icon in the browser’s toolbar.
2)Click on the "Power" button.
3)Click on the "Refresh" button.
Go back

Disable uBlock

Follow these easy steps to disable uBlock

1)Click on the icon in the browser’s toolbar.
2)Click on the "Power" button.
3)Click on the "Refresh" button.
Go back
Back
Top