Cumulative Monthly Report

xrobc

New Member
Joined
Feb 25, 2015
Messages
27
Hi

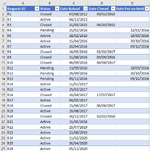
I have a range of data that looks something like the attached image. The data is from an external database that I have cleaned up in Power Query (it wouldn't clean up in Power Pivot) and brought into Excel.

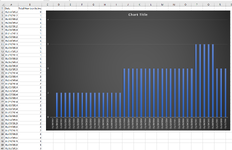
I would like to produce a cumulative monthly report that total of requests that were open at a specific date (such as the 1st day of the month).

I could produce a separate table with my list of dates, but was hoping to generate this somehow from the date range so that I don't need to keep adding in extra dates. Is there some way that I can do this with DAX?

I already have the table added to my Power Pivot Data Model and have some other Power Pivot Tables in the workbook and was hoping to produce something similar.

Thanks
 

Attachments

  • requests.png
    requests.png
    45.7 KB · Views: 23

Excel Facts

Which Excel functions can ignore hidden rows?
The SUBTOTAL and AGGREGATE functions ignore hidden rows. AGGREGATE can also exclude error cells and more.
Based upon the data provided, please mock up what your expected results should look like.
 
Upvote 0
Based upon the data provided, please mock up what your expected results should look like.
Thanks for the reply.

This is the sort of graph that I was hoping to end up with, just not sure how to get there.
 

Attachments

  • count.png
    count.png
    153.5 KB · Views: 13
Upvote 0
Using this table:
Book1
ABCDE
1Request IDStatusDate RaisedDate ClosedDate put on Hold
2R1Active11/29/201801/31/2019
3R2Pending10/29/2016
4R3Active06/06/201608/31/2016
5R4Pending10/26/2014
6R5Pending12/07/201702/28/2018
7R6Pending02/21/2016
8R7Pending10/15/201512/31/2015
9R8Active03/14/201805/31/2018
10R9Pending01/23/201403/31/2014
11R10Pending01/07/201903/31/2019
12R11Pending05/16/201907/31/2019
13R12Active02/03/2018
14R13Pending03/11/201405/31/2014
15R14Active03/01/2013
16R15Active07/13/2012
17R16Active10/05/2014
18R17Pending01/31/201803/31/2018
19R18Pending10/25/201212/31/2012
20R19Pending02/05/201804/30/2018
21R20Active02/01/2013
22R21Pending08/26/2018
23R22Pending10/29/201212/31/2012
24R23Active08/17/201610/31/2016
25R24Pending09/22/201411/30/2014
26R25Pending03/15/2019
Sheet2
(Which took longer to do than the solution! PLEASE use XL2BB when posting data!)
I added this to the table in PQ:
Power Query:
= Table.AddColumn(#"Changed Type", "Start of Month", each Date.StartOfMonth([Date Raised]), type date)
and loaded it to a Pivot Table/Chart:
Book1
GH
4Month StartCount
507/01/20121
610/01/20122
702/01/20131
803/01/20131
901/01/20141
1003/01/20141
1109/01/20141
1210/01/20142
1310/01/20151
1402/01/20161
1506/01/20161
1608/01/20161
1710/01/20161
1812/01/20171
1901/01/20181
2002/01/20182
2103/01/20181
2208/01/20181
2311/01/20181
2401/01/20191
2503/01/20191
2605/01/20191
27Grand Total25
Sheet2

1673271778512.png

Hope that helps!
 
Upvote 0
Thanks.

I appear to be missing something here......:confused:

To which table do I add the Column? My table of data or my table of month start dates?

Neither seem to work for me?

Also, I was looking for a cumulative total of the number that we Active on a given date. Doesn't this give me the total raised in a month?
You add the M Code I posted to the last line of your current query:
Power Query:
= Table.AddColumn(#"Changed Type", "Start of Month", each Date.StartOfMonth([Date Raised]), type date)
From PQ to get a chart you have to have a Pivot Table to base the chart on which is included above.
 
Upvote 0
You add the M Code I posted to the last line of your current query:
Power Query:
= Table.AddColumn(#"Changed Type", "Start of Month", each Date.StartOfMonth([Date Raised]), type date)
From PQ to get a chart you have to have a Pivot Table to base the chart on which is included above.
Thanks, I think I got it working.

However, it's giving me a count of raised each start of the month.

I was hoping to get a total of the number that are "Active" at the start of each month.
 
Upvote 0
Thanks.

I appear to be missing something here......:confused:

To which table do I add the Column? My table of data or my table of month start dates?

Neither seem to work for me?

Also, I was looking for a cumulative total of the number that we Active on a given date. Doesn't this give me the total raised in a month?
Remove all but Active in the query before the line I provided.
 
Upvote 0

Forum statistics

Threads
1,215,743
Messages
6,126,605
Members
449,321
Latest member
syzer

We've detected that you are using an adblocker.

We have a great community of people providing Excel help here, but the hosting costs are enormous. You can help keep this site running by allowing ads on MrExcel.com.
Allow Ads at MrExcel

Which adblocker are you using?

Disable AdBlock

Follow these easy steps to disable AdBlock

1)Click on the icon in the browser’s toolbar.
2)Click on the icon in the browser’s toolbar.
2)Click on the "Pause on this site" option.
Go back

Disable AdBlock Plus

Follow these easy steps to disable AdBlock Plus

1)Click on the icon in the browser’s toolbar.
2)Click on the toggle to disable it for "mrexcel.com".
Go back

Disable uBlock Origin

Follow these easy steps to disable uBlock Origin

1)Click on the icon in the browser’s toolbar.
2)Click on the "Power" button.
3)Click on the "Refresh" button.
Go back

Disable uBlock

Follow these easy steps to disable uBlock

1)Click on the icon in the browser’s toolbar.
2)Click on the "Power" button.
3)Click on the "Refresh" button.
Go back
Back
Top