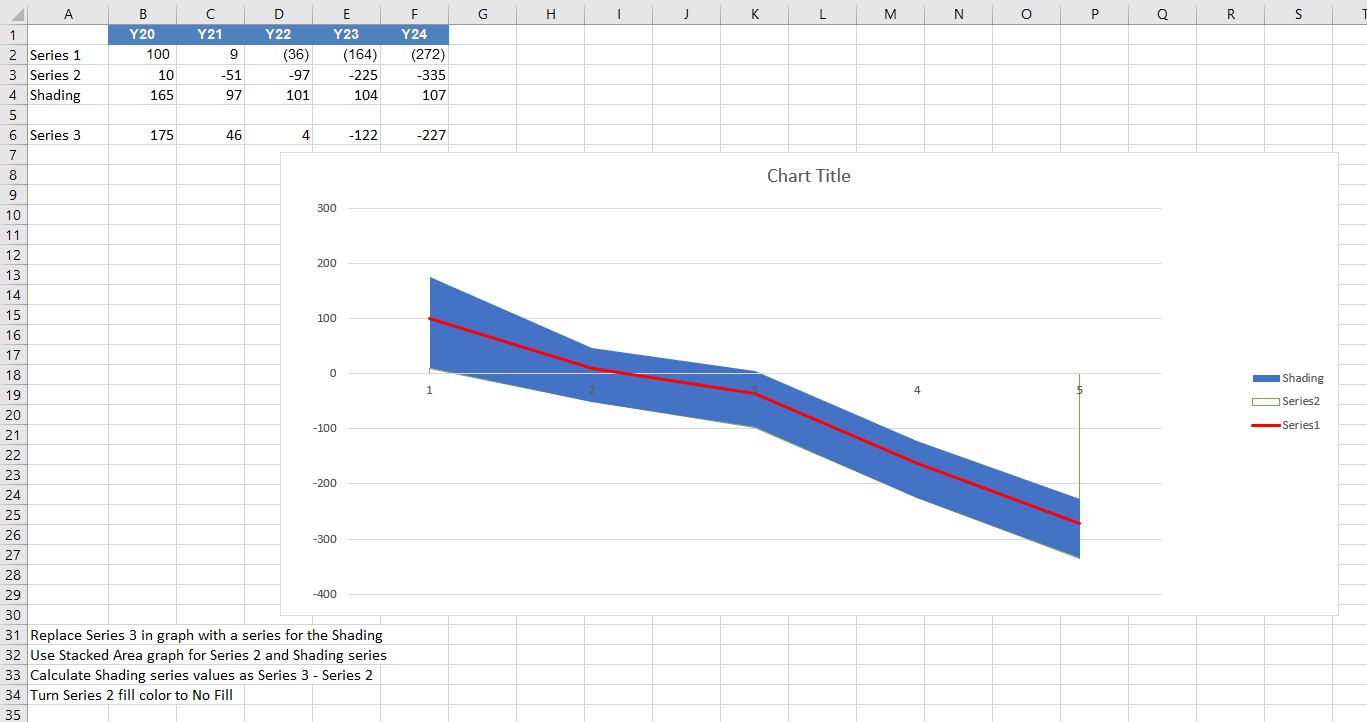
I am looking to plot a line graph with upper and lower limits (Ranges). Attached is the target view (PNG).
The value that I have, has positive and negative values. Hence showing upper limit and lower limit range in the line chart is a bit complex. Attached is the excel sheet(Sample.xlsx) with main values(Series 1), Upper limit(Series 3) and lower limit(Series 2).
<colgroup><col><col span="5"></colgroup><tbody>
</tbody>
Regards, Ravi
The value that I have, has positive and negative values. Hence showing upper limit and lower limit range in the line chart is a bit complex. Attached is the excel sheet(Sample.xlsx) with main values(Series 1), Upper limit(Series 3) and lower limit(Series 2).
| Y20 | Y21 | Y22 | Y23 | Y24 | |
| Series 1 | 100 | 9 | (36) | (164) | (272) |
| Series 2 | 10 | -51 | -97 | -225 | -335 |
| Series 3 | 175 | 46 | 4 | -122 | -227 |
<colgroup><col><col span="5"></colgroup><tbody>
</tbody>
Regards, Ravi