andrewb90
Well-known Member
- Joined
- Dec 16, 2009
- Messages
- 1,077
Hello All,
I have started trying to do 10 -12 year forecasting model for my business. I tried using some various equations but none of them have given me what I am looking for. Starting in 2013 through 2018 I will be opening 30 new stores. 5 one year and six the next. so 2013 - 5, 2014 -6, 2015 -5, 2016 -6, 2017 -5, 2018 -3. That would total all 30 stores.
The way that I have estimated it is by the number of months a store will be providing sales I am estimating 38 months for the 5 store years and 42 months for the 6 store years, as well as 30 months for the final opening year.
Every week I anticipate weekly sales to be 10k Gross and 1K Profit (based on 10% owner profit takehome). Averaged into monthly totals for my equation I have:
Monthly Gross Sales 43,333.33 Monthly Profit: 4,333.33
Now every year I anticipate a 7% Gross sales increase and a profit increase of 0.6%.
I have calculated all of that just fine, however my issue is that I want to cap out a store's Gross sales at 67,166.66 a month (15,500/wk) and a max profit of 15%.
I have included a sample image of the spreadsheet (hosted on photobucket) to give you and idea of what I have so far
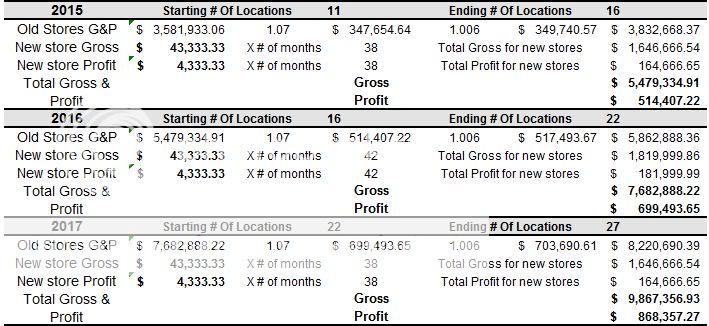
Following the year 2018 (years 2019-2022)I will have no new stores add and only increasing sales and profitability to think about, but I want to be able to show the increase in sales from the most recently opened stores without having the very first store opened have sales that are beyond what could be predicted.
I hope everything makes sense so far. I hope somebody can be of some assistance because I am lost at this time.
Thanks in advance,
Andrew
I have started trying to do 10 -12 year forecasting model for my business. I tried using some various equations but none of them have given me what I am looking for. Starting in 2013 through 2018 I will be opening 30 new stores. 5 one year and six the next. so 2013 - 5, 2014 -6, 2015 -5, 2016 -6, 2017 -5, 2018 -3. That would total all 30 stores.
The way that I have estimated it is by the number of months a store will be providing sales I am estimating 38 months for the 5 store years and 42 months for the 6 store years, as well as 30 months for the final opening year.
Every week I anticipate weekly sales to be 10k Gross and 1K Profit (based on 10% owner profit takehome). Averaged into monthly totals for my equation I have:
Monthly Gross Sales 43,333.33 Monthly Profit: 4,333.33
Now every year I anticipate a 7% Gross sales increase and a profit increase of 0.6%.
I have calculated all of that just fine, however my issue is that I want to cap out a store's Gross sales at 67,166.66 a month (15,500/wk) and a max profit of 15%.
I have included a sample image of the spreadsheet (hosted on photobucket) to give you and idea of what I have so far
Following the year 2018 (years 2019-2022)I will have no new stores add and only increasing sales and profitability to think about, but I want to be able to show the increase in sales from the most recently opened stores without having the very first store opened have sales that are beyond what could be predicted.
I hope everything makes sense so far. I hope somebody can be of some assistance because I am lost at this time.
Thanks in advance,
Andrew
")


