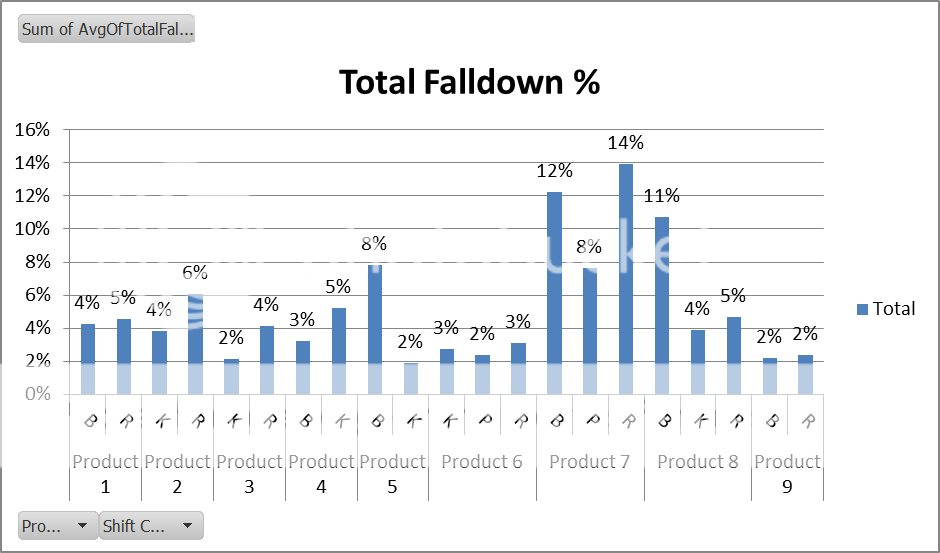
Hi All,
I have a table with the following columns that i wanted to report based on the shift colour the product was manufactured in but im not sure what statements to use for my query.
The shift colur relates to the 3rd character from the left of the Batch number, where B= Blue, K = Black, P = purple, and R = Red.
Date, Product, Product total, Sum of downgrades, Batch #, Downgrade 1, Downgrade2,..50
10/10 15CD 1398 4 PWB100 2 , 2 ,
10/10 15CD 1398 3 PWK107 1 , 2 ,
10/10 15CD 1398 10 PWP205 8 , 2 ,
15/10 17NS 744 8 PWB408 3 , 2 ,
15/10 17NS 744 11 PWR550 6 , 2 ,
15/10 17NS 744 12 PWR551 4 , 2 ,
Ive generated a query ( group by/ sum) to get a single row for each product and shift colour:
-used the MID function to get me the 3rd letter for the shift colour so i can group them.
- Used the total (by Max) for the product total to get it to a singe row for each product.
- summed the downgrades.
- Total falldown % = (sum of downgrades/Product total).
i just need my report to produce the following for each shift colour besides each other under the detail section based on the date inputs:
ie.
from 10/10/2016 to 15/10/2016
Label Header
Product: 15CD
Detail
Blue - B shift: Red-R shift: Black - Shift: Purple - P Shift
Total falldown: 0.3%
Product total: 1398
Top 5 downgrades
based on sum
(Transposed)
Downgrade 1 2
Downgrade 2 2
Downgrade 3 .
Downgrade 4 .
Downgrade 5 .
Product: 17NS
Detail
Blue - B Shift Red - R shift: Black shift , Purple Shift
Total falldown: 1.1% Total falldown: 3.1%
Product total: 744 Product total: 744
Top 5 downgrades Top 5 downgrades
based on sum based on sum
(transposed) (Transposed)
Downgrade 1 3 Downgrade 1 10
Downgrade 2 2 Downgrade 2 4
Downgrade 3 . Downgrade 3 .
Downgrade 4 . Downgrade 4 .
Downgrade 5 . Downgrade 5 .
If anyone has some guidance that will be greatly appreciated.
Kind regards


