Graph issue

Geeyj

New Member
Joined
Sep 26, 2021
Messages
3
Office Version
  1. 2013
Platform
  1. Windows
  2. MacOS
Dear Experts,

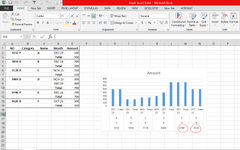
I drew a graph for a 500 rows data, it has multiple columns as shown in the attached. When I draw the column graph(or any type of graph) and enlarge the graph (if I don't enlarge the graph, can't read it's too tiny) some of the numbers in column A (column A in the attached) are missing. In the attached, I've only shown few rows so no issue with the graph but when I cover all 500 rows circled numbers and more are missing. Hope to get some help. Thank you.
 

Attachments

  • Graph issue.png
    Graph issue.png
    67 KB · Views: 12

Excel Facts

Remove leading & trailing spaces
Save as CSV to remove all leading and trailing spaces. It is faster than using TRIM().

Forum statistics

Threads
1,215,097
Messages
6,123,076
Members
449,094
Latest member
mystic19

We've detected that you are using an adblocker.

We have a great community of people providing Excel help here, but the hosting costs are enormous. You can help keep this site running by allowing ads on MrExcel.com.
Allow Ads at MrExcel

Which adblocker are you using?

Disable AdBlock

Follow these easy steps to disable AdBlock

1)Click on the icon in the browser’s toolbar.
2)Click on the icon in the browser’s toolbar.
2)Click on the "Pause on this site" option.
Go back

Disable AdBlock Plus

Follow these easy steps to disable AdBlock Plus

1)Click on the icon in the browser’s toolbar.
2)Click on the toggle to disable it for "mrexcel.com".
Go back

Disable uBlock Origin

Follow these easy steps to disable uBlock Origin

1)Click on the icon in the browser’s toolbar.
2)Click on the "Power" button.
3)Click on the "Refresh" button.
Go back

Disable uBlock

Follow these easy steps to disable uBlock

1)Click on the icon in the browser’s toolbar.
2)Click on the "Power" button.
3)Click on the "Refresh" button.
Go back
Back
Top