Graph with Bars (Ranges) & Lines

SHardin

New Member
Joined
Oct 30, 2019
Messages
1
Hello,

How would I go about making a graph which plots a number of bars (representing ranges) and lines on the same graph as per below:


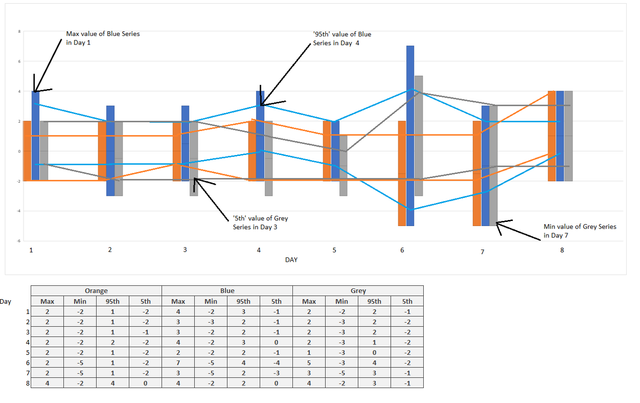
I would like the lines (which represent the 5th and 95th percentiles of the ranges) to intersect the range as shown in the image.

Any ideas?
R7P9YZp
 

Excel Facts

Add Bullets to Range
Select range. Press Ctrl+1. On Number tab, choose Custom. Type Alt+7 then space then @ sign (using 7 on numeric keypad)

Forum statistics

Threads
1,217,364
Messages
6,136,117
Members
449,993
Latest member
Sphere2215

We've detected that you are using an adblocker.

We have a great community of people providing Excel help here, but the hosting costs are enormous. You can help keep this site running by allowing ads on MrExcel.com.
Allow Ads at MrExcel

Which adblocker are you using?

Disable AdBlock

Follow these easy steps to disable AdBlock

1)Click on the icon in the browser’s toolbar.
2)Click on the icon in the browser’s toolbar.
2)Click on the "Pause on this site" option.
Go back

Disable AdBlock Plus

Follow these easy steps to disable AdBlock Plus

1)Click on the icon in the browser’s toolbar.
2)Click on the toggle to disable it for "mrexcel.com".
Go back

Disable uBlock Origin

Follow these easy steps to disable uBlock Origin

1)Click on the icon in the browser’s toolbar.
2)Click on the "Power" button.
3)Click on the "Refresh" button.
Go back

Disable uBlock

Follow these easy steps to disable uBlock

1)Click on the icon in the browser’s toolbar.
2)Click on the "Power" button.
3)Click on the "Refresh" button.
Go back
Back
Top