How do I make a line graph from this data?

Sundlof

New Member
Joined
Feb 15, 2024
Messages
2
Office Version
  1. 365
Platform
  1. Windows
Hi,
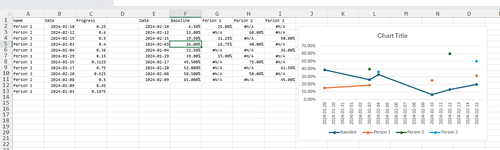
I want to create a line graph to map progress for a couple of people. On the X axis I want date, I have Min and Max but manually can do. On the Y axis I have 0 to 100%. The progress is entered in a three column table with Name, Date and progress. So Person 1 can have multiple entries with 2024-01-01 5%, 2024-01-15 16% and so on up to 100%.

I want to track each individual as their own line and also create a base line with a start and end date from 0 to 100% and compare if they are above or under the target progress.

How do I accomplish this?
 

Excel Facts

Show numbers in thousands?
Use a custom number format of #,##0,K. Each comma after the final 0 will divide the displayed number by another thousand
Why do you need 3 Columns? Take your 3 column list and pivot it into a crosstab. I guess on what you want for a baseline.

1707988666577.png
 

Attachments

  • 1707988121215.png
    1707988121215.png
    48 KB · Views: 6
  • 1707988571383.png
    1707988571383.png
    52.3 KB · Views: 2
Last edited:
Upvote 0
Why do you need 3 Columns? I don't know what your baseline curve is to put those in.

View attachment 106900


Hi, and thanks for the reply.
The reason the data looks like this is that not all people gets an update the same day. I might be several days between, like the example below. The baseline is only a linear line going from a start date to an end date straight from 0 to 100%. So I thought this the data will be easier to update, I just add a new line when I get some update on someone progress.
I am all open for any other approach on this! :)

NameDateProgress
Person 12024-02-1025%
Person 22024-02-1260%
Person 32024-02-1550%
Person 22024-02-0340%
Person 32024-02-0436%
Person 12024-01-2915%
 
Upvote 0
You can still create a crosstab using NA for missing value and the lines will continue, Here is a line chart with markers:

1707989658760.png
 

Attachments

  • 1707989503093.png
    1707989503093.png
    60.3 KB · Views: 5
Upvote 0

Forum statistics

Threads
1,215,085
Messages
6,123,030
Members
449,092
Latest member
ikke

We've detected that you are using an adblocker.

We have a great community of people providing Excel help here, but the hosting costs are enormous. You can help keep this site running by allowing ads on MrExcel.com.
Allow Ads at MrExcel

Which adblocker are you using?

Disable AdBlock

Follow these easy steps to disable AdBlock

1)Click on the icon in the browser’s toolbar.
2)Click on the icon in the browser’s toolbar.
2)Click on the "Pause on this site" option.
Go back

Disable AdBlock Plus

Follow these easy steps to disable AdBlock Plus

1)Click on the icon in the browser’s toolbar.
2)Click on the toggle to disable it for "mrexcel.com".
Go back

Disable uBlock Origin

Follow these easy steps to disable uBlock Origin

1)Click on the icon in the browser’s toolbar.
2)Click on the "Power" button.
3)Click on the "Refresh" button.
Go back

Disable uBlock

Follow these easy steps to disable uBlock

1)Click on the icon in the browser’s toolbar.
2)Click on the "Power" button.
3)Click on the "Refresh" button.
Go back
Back
Top