chriscorpion786
Board Regular
- Joined
- Apr 3, 2011
- Messages
- 108
- Office Version
- 365
- Platform
- Windows
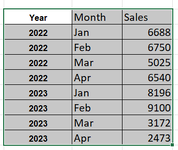
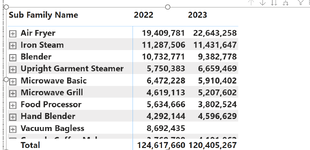
Hi All,
I have year spanning down the same column, how can I calculate the variance and show it in a table format in Power BI.
I have put the Year into Columns and total sales in Values.
Cannot seem to get the variance calculation to work for the column.
Thanks in advance.
I have year spanning down the same column, how can I calculate the variance and show it in a table format in Power BI.
I have put the Year into Columns and total sales in Values.
Cannot seem to get the variance calculation to work for the column.
Thanks in advance.