Modifying trendline so that is <= all points on a plot (more of a "lowest limit")

rark

New Member
Joined
Oct 7, 2021
Messages
1
Office Version
  1. 2019
Platform
  1. MacOS
Hello,

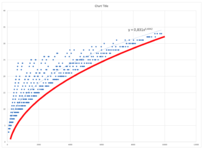
I have a plot where I want to calculate the "lower limit" of all points. (See the red line in the attached image I would like to calculate)
The trendline function easily gives me an power-function through the the plot, could I perhaps adjust this so that all points is equal or larger to the trendline?

Best regards,
 

Attachments

  • Screenshot 2021-10-07 at 10.14.20.png
    Screenshot 2021-10-07 at 10.14.20.png
    149.9 KB · Views: 9

Excel Facts

What is the shortcut key for Format Selection?
Ctrl+1 (the number one) will open the Format dialog for whatever is selected.

Forum statistics

Threads
1,216,069
Messages
6,128,602
Members
449,460
Latest member
jgharbawi

We've detected that you are using an adblocker.

We have a great community of people providing Excel help here, but the hosting costs are enormous. You can help keep this site running by allowing ads on MrExcel.com.
Allow Ads at MrExcel

Which adblocker are you using?

Disable AdBlock

Follow these easy steps to disable AdBlock

1)Click on the icon in the browser’s toolbar.
2)Click on the icon in the browser’s toolbar.
2)Click on the "Pause on this site" option.
Go back

Disable AdBlock Plus

Follow these easy steps to disable AdBlock Plus

1)Click on the icon in the browser’s toolbar.
2)Click on the toggle to disable it for "mrexcel.com".
Go back

Disable uBlock Origin

Follow these easy steps to disable uBlock Origin

1)Click on the icon in the browser’s toolbar.
2)Click on the "Power" button.
3)Click on the "Refresh" button.
Go back

Disable uBlock

Follow these easy steps to disable uBlock

1)Click on the icon in the browser’s toolbar.
2)Click on the "Power" button.
3)Click on the "Refresh" button.
Go back
Back
Top