Pivot Chart Legend/values Slicer?

moose79

New Member
Joined
Apr 17, 2022
Messages
6
Office Version
  1. 365
Platform
  1. MacOS
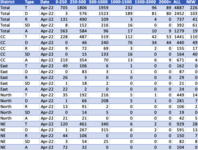
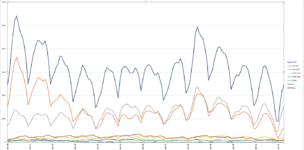
Ive got a pivot line chart, with multiple values represented through lines. Is there a way to make a slicer for the values/legend? Id like to turn some lines on/off without having to remove/add them in the values area.
 

Attachments

  • Screenshot at Jun 02 12-56-02.png
    Screenshot at Jun 02 12-56-02.png
    61.8 KB · Views: 16
  • Screenshot at Jun 02 12-29-31.png
    Screenshot at Jun 02 12-29-31.png
    116.5 KB · Views: 16

Excel Facts

Copy PDF to Excel
Select data in PDF. Paste to Microsoft Word. Copy from Word and paste to Excel.
It depends on the original data layout. Below are two layouts that product the same pivot chart.

Layout 1 is already cross-tabbed (also called unstacked), so it has each plotted series in its own column or field. Since a slicer can only allow selection between elements within a field and not between fields, you cannot have a slicer for the series (legend entries) in the chart. This matches the layout of your original data, so you can't have a slicer for your legend entries.

PivotDataLayout1.png


Layout 2 is stacked. All values are in a single column (field) and are identified by elements in another column (field), called "groups" in my example. Since the values are all on one field, and the legend entry names are all in another, you can create a slicer for group, which will allow filtering of the series within the chart. You could rearrange your data into this layout to provide the slicer you want.

PivotDataLayout2.png
 
Upvote 0
It depends on the original data layout. Below are two layouts that product the same pivot chart.

Layout 1 is already cross-tabbed (also called unstacked), so it has each plotted series in its own column or field. Since a slicer can only allow selection between elements within a field and not between fields, you cannot have a slicer for the series (legend entries) in the chart. This matches the layout of your original data, so you can't have a slicer for your legend entries.

View attachment 66264

Layout 2 is stacked. All values are in a single column (field) and are identified by elements in another column (field), called "groups" in my example. Since the values are all on one field, and the legend entry names are all in another, you can create a slicer for group, which will allow filtering of the series within the chart. You could rearrange your data into this layout to provide the slicer you want.

View attachment 66267
Thanks for the response Jon. Its a decent workaround that I may try for my next data set. Ill just have to structure my data source differently I suppose.

I did find a VBA workaround too, if anyone else runs into a similar issue.
 
Upvote 0

Forum statistics

Threads
1,216,075
Messages
6,128,660
Members
449,462
Latest member
Chislobog

We've detected that you are using an adblocker.

We have a great community of people providing Excel help here, but the hosting costs are enormous. You can help keep this site running by allowing ads on MrExcel.com.
Allow Ads at MrExcel

Which adblocker are you using?

Disable AdBlock

Follow these easy steps to disable AdBlock

1)Click on the icon in the browser’s toolbar.
2)Click on the icon in the browser’s toolbar.
2)Click on the "Pause on this site" option.
Go back

Disable AdBlock Plus

Follow these easy steps to disable AdBlock Plus

1)Click on the icon in the browser’s toolbar.
2)Click on the toggle to disable it for "mrexcel.com".
Go back

Disable uBlock Origin

Follow these easy steps to disable uBlock Origin

1)Click on the icon in the browser’s toolbar.
2)Click on the "Power" button.
3)Click on the "Refresh" button.
Go back

Disable uBlock

Follow these easy steps to disable uBlock

1)Click on the icon in the browser’s toolbar.
2)Click on the "Power" button.
3)Click on the "Refresh" button.
Go back
Back
Top