Power Query - Function (Average Daily Balance) - Repeat for Each Dynamically Named Column and Dynamically Changing Number of Columns

KnightFhawker

New Member
Joined
Dec 7, 2016
Messages
17
Office Version
  1. 365
  2. 2016
Platform
  1. Windows
  2. Mobile
  3. Web
Hello,

It has been a very long time since I have posted on here, so I apologize in advance if I am rusty on any preferred protocol and information/data to include on a post.

I need to be able to able to obtain the average daily balance of each case, for each quarter. Since I have not found a simple function in Power Query to accomplish this directly, I am structuring the data to create a listing of the balance for each day. I will then take the average for each quarter as needed.

Through my research online, I have been able to accomplish this daily balance (running total) for one individual case using a Power Query function, but since I have many different cases (each with a different case number as the column header), I have been unable to find the right coding to repeat this function for each of the cases.

Two main hurdles are that not only will the headers (case numbers) be changing each time the data is pulled, but the number of cases (columns) will also be changing. With these two hurdles in mind, I need to be able to repeat the function, to have each run of the function add the resulting column to the same table, and have the function repeat based upon the dynamically varying number of columns that will have differing column header names. To begin working toward resolving this issue, I have built a query that can be used as a reference list for all of the column names (case numbers) in List format (Query name: MasterCaseList).

I hope that this information, along with some screenshots and sample code that I have listed below, will provide a clear understanding of what I need to accomplish and where I am currently stuck at in the process. Any assistance would be greatly appreciated. Please let me know if you have any questions, and if there is any additional information that I can provide to make things more clear.

CalendarCaseActivity (Single Column)- Power Query Editor.png


Code for Power Query Function: fxRunningTotal

Power Query:
(values as list) as list =>

let
    RT = List.Generate
    (
        () => [RT = values{0}, counter = 0],
        each [counter] < List.Count(values),
        each [RT = [RT] + values{[counter] + 1}, counter = [counter] + 1],
        each [RT]
    )
in
    RT


Code for Query: CalendarCaseAverages

Power Query:
let
    Source = CalendarCaseActivity[Case1],
    BufferedValues = List.Buffer(Source),
    RT = Table.FromList(fxRunningTotal(BufferedValues), Splitter.SplitByNothing(), {"RT"}),
    Columns = List.Combine({Table.ToColumns(RT)}),
    #"Converted To Table" = Table.FromColumns(Columns, List.Combine({Table.ColumnNames(CalendarCaseActivity)}))

in
    #"Converted To Table"


CalendarCaseAverages - Power Query Editor.png


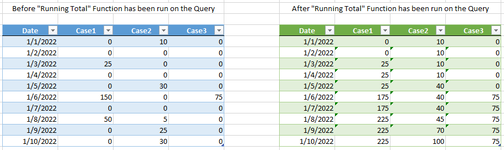
The above screenshots and code show the successful run of the function, which essentially provides a running total list to capture the total balance, for a single case, for each date. However, the full table has many columns listing the activity for each case, by date, throughout the full period of time pulled from the source system.

The additional complexity to this is that there will always be a dynamic header that will be the actual case numbers ("A12345", "B45678", etc., instead of "Case1", "Case2", and "Case3", which I used to keep this example generic). Also, the number of columns will change each quarter when the complete data is pulled for the full period of time, up to the most recent quarter (See screenshot below).

I am trying to code the "CalendarCaseAverages" Query to repeat the function above for each dynamically named column, and for each of the dynamically changing number of cases that will be included each subsequent quarter.

I imagine that a List.Generate or List.Accumulate might be helpful functions to use, but either way I am unsure how to even reference the Source and incorporate the function to allow for more than one column of data since both sets of code are based upon "List" functions.

I am using Power Query, because this data will eventually need to dynamically populate tables into an Excel workbook for each individual month.

Again, I hope all of this information makes sense, and that I have provided what would be needed to understand where I stand at the moment, but please do not hesitate to ask any questions or inquire about any additional information that you believe would be helpful.

Any suggestion would be greatly appreciated. Thank you in advance for your time and assistance.

CalendarCaseActivity (Mulitple Columns with Dates) - Power Query Editor.png
 

Excel Facts

Wildcard in VLOOKUP
Use =VLOOKUP("Apple*" to find apple, Apple, or applesauce
Have you considered unpivoting your data and then doing a group by using the Date and Case to create an average. Would be helpful instead of pictures to upload some sample data using XL2BB that we can manipulate. Also, for the data provided, mock up your expected results.
 
Upvote 0
Have you considered unpivoting your data and then doing a group by using the Date and Case to create an average. Would be helpful instead of pictures to upload some sample data using XL2BB that we can manipulate. Also, for the data provided, mock up your expected results.
Hello alansidman,

Thank you for your reply. Since I am currently at work I cannot freely install any add-ons to Excel as this is installed and controlled by the organization administrator for all users, and all of my coding and data are stored on my work network, inaccessible from my personal computer. Although this does seem like a useful tool and a new option since I last posted a thread on here, I will have to try to find a work-around to accomplish using XL2BB, if this extra step is needed.

Regarding unpivoting and grouping the data, I am unsure how this would help since the whole purpose of structuring it this way and running the custom function is to first distribute the amounts as balances on those specific days. I specifically performed the pivot in the first place to get the data in this format in order to be able to create running totals for each case. The original data is a list of transactions by case and date.

Without pivoting and performing this running total function step for each case, I would only be averaging single transactional amounts rather than the ongoing balances that those transactions bring about. For example, if there were two deposit-related transactions (adding to the account) of $1,000 and $5,000 that occurred the first two days respectively in a 90 day quarter, the end of the quarter balance would be $6,000 and the average daily balance for the quarter would be $5,944.44 ( (1,000 + (6,000*89)/90 or 535,000/90). Whereas, taking the average of the two transactions totaled together without first distributing the running balance, would instead be $66.67 (6,000/90), resulting in a significant difference of about $5,877.77.

I hope this helps to clarify the need for this step. Unfortunately also, having limitations from using work-based software, does make processes difficult in many ways, such as still having to be stuck on Excel/Office 2016 rather than 2021 or 365.

Any additional suggestions or guidance would be greatly appreciated. In the meantime I will look for a work-around for using XL2BB if at all possible.

Thank you.
 
Upvote 0
I am a bit of a visual person. Can't really help you without a visual. Hopefully, someone else can uncomplicate your explanation without the visuals. Good Luck. I'm out.
 
Upvote 0
I am a bit of a visual person. Can't really help you without a visual. Hopefully, someone else can uncomplicate your explanation without the visuals. Good Luck. I'm out.
Hi alansidman,

I appreciate you taking the time initially at least to review my thread post. I am a visual person too which is why I thought to post each of the screenshots of exactly how the data source is structured, how the data looks before the function is run, and how the data looks after the function has run, along with all of the code for reference. I added the extra information particularly because I am trying to be as helpful as possible within my limitations under organizational IT security restrictions, and some who assist prefer to be able to write the code directly into the existing code; however, this is not necessary. My apologies for the security limitations I am under, but unfortunately this strict IT-based security is the reality within most organizations these days, and is even pushed by Microsoft itself within their security protocol recommendations. I have approached my need differently below with the goal of making my inquiry more clear, and without regard to my current code.

Without regard to all of that additional visual screenshot and code information that I provided, I am again simply looking for a way to repeat a function on a table for each column within the table. The names of the columns can easily be setup as a separate query in list format as a reference, but I have not be able to locate coding on how to repeat a function for each column. I am assuming it would be a relatively simple loop code for each column within a list.

I do not even need any assistance with the code I have listed necessarily. Please disregard my current code and screenshot visuals altogether if they are causing any confusion. I am simply looking for code that repeats/loops a function for every column, either provided in a queried list I can create, or by referencing every column that exists within the same query, whichever would be easier.

The results of each function run need to be added as a separate column within the same query (or can overwrite/"Transform" the same column referenced, which is why I would guess that either a List.Generate or List.Accumulate function will be helpful within the coding structure.

For example, the following are Excel table visuals on how the query data would appear before the "Running Total" Function is run, and then after the "Running Total" Function has been run within Power Query. The "Running Total" Function I am using goes down a single column and adds any amount within a field to the sum total of the amounts that occur above it. Using the example below, in C5 the cell/field amount is 0 so H5 stays 0, and the same occurs for C6 and H6 since C6 is 0 (0 + 0 = 0). In C7 there is 25 so H7 adds 25 to the sum total of 0 (0 + 0 + 25 = 25). C8 has a 0, so H8 remains 25 (0 + 0 + 25 + 0 = 25). However, in C10 is 150, so H10 is 175 (0 + 0 + 25 + 0 + 0 + 150 = 175). This continues until the last row of the column.

Currently my code will only run this function for one column, in this case Case1 then it will stop. I simply need to discover the code that will allow my function to run for "each" column, Case1, Case2, and Case3, then stop. I can easily build a query list that will list {"Case1", "Case2", "Case3"} if it is easier than trying to reference the "Before" query columns themselves.

Before and After Results Example 20220706.png


Again, I hope that this helps to clarify that I am looking for specific looping code and not any specific fix to my current code. Please feel free to ask any follow up questions at any time, as I would be happy to provide any clarification or data I am able to within my limitations.

Thank you in advance to you or anyone willing and able to assist. I would be very grateful for your assistance.
 

Attachments

  • Before and After Results Example 20220706.png
    Before and After Results Example 20220706.png
    16.5 KB · Views: 11
Upvote 0
Power Query:
let
    tbl = Table.TransformColumnTypes(Table.FromRows(Json.Document(Binary.Decompress(
        Binary.FromText("RZDLDcAgDEN34Vyp5FMKs1Tdf43iKHEPWIhHnMTP0+SUU7tqO5r1LXFTb+8BpsUkPiywlczI8HpDZiIv5GGJP5boKqQDYmCSbLAsusHSNNnNKa8tGMSq2+QgMQS4l+ViGTqhpfRE0lmHd8el9haGIrCTWLw85U9lbsFRmjIV1BlMbRRjLLEZYtupvB8=", 
        BinaryEncoding.Base64), Compression.Deflate)), let _t = ((type nullable text) meta [Serialized.Text = true]) in type table [Date = _t, Case1 = _t, Case2 = _t, Case3 = _t]),
        {{"Date", type date}, {"Case1", Int64.Type}, {"Case2", Int64.Type}, {"Case3", Int64.Type}}),

    
    lst = Table.ToColumns(tbl),
    ListRunningSum = (lst) => List.Accumulate({1..List.Count(lst)-1}, {lst{0}}, (s,c) => s & {List.Last(s) + lst{c}}),
    lst1 = {lst{0}} & List.Transform(List.Skip(lst,1), each ListRunningSum(_)),
    Result = Table.FromColumns(lst1, Table.ColumnNames(tbl))
in
    Result
 
Upvote 0
Cross-posting (posting the same question in more than one forum) is not against our rules, but the method of doing so is covered by #13 of the Forum Rules.

Be sure to follow & read the link at the end of the rule too!

Cross posted at: Power Query - Function (Average Daily Balance) - Repeat for Each Dynamically Named Column and Dynamically Changing Number of Columns - OzGrid Free Excel/VBA Help Forum
If you have posted the question at more places, please provide links to those as well.

If you do cross-post in the future and also provide links, then there shouldn’t be a problem.
 
Upvote 0
Power Query:
let
    tbl = Table.TransformColumnTypes(Table.FromRows(Json.Document(Binary.Decompress(
        Binary.FromText("RZDLDcAgDEN34Vyp5FMKs1Tdf43iKHEPWIhHnMTP0+SUU7tqO5r1LXFTb+8BpsUkPiywlczI8HpDZiIv5GGJP5boKqQDYmCSbLAsusHSNNnNKa8tGMSq2+QgMQS4l+ViGTqhpfRE0lmHd8el9haGIrCTWLw85U9lbsFRmjIV1BlMbRRjLLEZYtupvB8=",
        BinaryEncoding.Base64), Compression.Deflate)), let _t = ((type nullable text) meta [Serialized.Text = true]) in type table [Date = _t, Case1 = _t, Case2 = _t, Case3 = _t]),
        {{"Date", type date}, {"Case1", Int64.Type}, {"Case2", Int64.Type}, {"Case3", Int64.Type}}),

   
    lst = Table.ToColumns(tbl),
    ListRunningSum = (lst) => List.Accumulate({1..List.Count(lst)-1}, {lst{0}}, (s,c) => s & {List.Last(s) + lst{c}}),
    lst1 = {lst{0}} & List.Transform(List.Skip(lst,1), each ListRunningSum(_)),
    Result = Table.FromColumns(lst1, Table.ColumnNames(tbl))
in
    Result
Hi JGordon11,

Thank you for taking the time to work through my inquiry, for putting together this code, and for trying to assist me with my inquiry. I very much appreciate your time and assistance.

I am confused about the Binary.FromText portion, including the long string of characters and how the need for Json.Document comes in, but I am sure this is due to my ignorance of this level of code at my early stages of trying to learn M code. The other issue that I would run into with the code that you have provided is that the column names are hard coded, and unfortunately the type of data I will be receiving will not only have "Case1", "Case2", etc. listed as the actual case numbers that will constantly change, but the number of cases/columns will be constantly changing also.

After my original post I was able to come across a couple of different sets of code that at least helped guide me in a direction that is some ways is similar to the code you have provided. Using all of these sets of code I have come up with coding that I believe gets me very close to what I need; however, I am now stuck at a spot on not knowing how to re-expand the data from a single field under each column having the full column of data compressed in individual "List" fields, and expanding each of those individual "List' fields into separate rows of data.

Although I have still not fully overcome my final hurdle with the coding for this query, I do believe that based upon the other code that I have come up with in conjunction with the code example you have provided, I have been able to overcome the bulk of this specific inquiry, and will need to create a different post to hopefully overcome where I am stuck at currently in my coding.

I have posted my code that I have come up with as of this point, along with a screenshot of the result, in case it can help anyone in the future with a similar issue. (I only have "Source" and #"Removed Columns" included because, due to my lack of experience and knowledge of M code, I am unsure how to get List.Accumulate started without having some sort of Table in place as the "state".

Thank you again for your time and assistance. I am very grateful.

Power Query:
let
    Cases = CaseList[CaseId],
    Source = Table.FromList({"a"}),
    LoopFunction = List.Accumulate({0..List.Count(Cases)-1}, Source, (state, current) => Table.AddColumn(state, Cases{current}, each 

    let
        Source = CalendarCaseActivity{current},
        BufferedValues = List.Buffer(Source),
        RT = fxRunningTotal(BufferedValues)
    in
        RT, type number))

    #"Removed Columns" = Table.RemoveColumns(LoopFunction,{"Column1"})
in
    #"Removed Columns"

Table of Lists (Cases) Screenshot 20220707.png


And to further clarify, each "List" does provide the running total as desired. To provide an example of how the resulting data looks in the "List" under column "A12345", it looks just like the following screenshot which I am re-pasting from one of the screenshots I pasted in my initial post:

CalendarCaseAverages - Power Query Editor.png
 
Upvote 0
Solution

Forum statistics

Threads
1,215,076
Messages
6,122,988
Members
449,093
Latest member
Mr Hughes

We've detected that you are using an adblocker.

We have a great community of people providing Excel help here, but the hosting costs are enormous. You can help keep this site running by allowing ads on MrExcel.com.
Allow Ads at MrExcel

Which adblocker are you using?

Disable AdBlock

Follow these easy steps to disable AdBlock

1)Click on the icon in the browser’s toolbar.
2)Click on the icon in the browser’s toolbar.
2)Click on the "Pause on this site" option.
Go back

Disable AdBlock Plus

Follow these easy steps to disable AdBlock Plus

1)Click on the icon in the browser’s toolbar.
2)Click on the toggle to disable it for "mrexcel.com".
Go back

Disable uBlock Origin

Follow these easy steps to disable uBlock Origin

1)Click on the icon in the browser’s toolbar.
2)Click on the "Power" button.
3)Click on the "Refresh" button.
Go back

Disable uBlock

Follow these easy steps to disable uBlock

1)Click on the icon in the browser’s toolbar.
2)Click on the "Power" button.
3)Click on the "Refresh" button.
Go back
Back
Top