Hello community,
I writed VBA code to update series of charts in worksheet. It chooses 1st chart, updates range (ranges are changing time to time) then loops untill last chart.
Previously it was working perfectly fine, then I made some changes and now it is giving strange results.
Here is the full code:
Code itself looks very complicated, but I guess problem is in CHARTDATA or SeriesCollection.
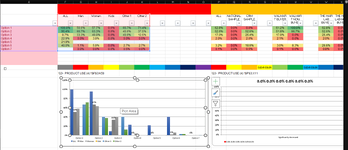
I am sharing expected result and sample workbook with hope someone can help me.

I writed VBA code to update series of charts in worksheet. It chooses 1st chart, updates range (ranges are changing time to time) then loops untill last chart.
Previously it was working perfectly fine, then I made some changes and now it is giving strange results.
Here is the full code:
VBA Code:
Sub UpdateChart() 'Excel VBA procedure to update the chart.
Dim CHARTDATA As Range
Dim i As Integer
Dim j As Long
Dim x As Long
Dim lw As Long
Dim LR As Long
Dim sh As Worksheet
Dim ws As Worksheet
Dim lc As Long
Dim lastCell As Range
Dim cell1 As Range
Dim B68 As Integer

Set sh = ActiveSheet
B68 = sh.Range("B68").Value


    x = 0

'Number of charts
    j = 1

'Find last col
    Dim Rng As Range, ii As Long, jj As Long
    ii = 6
    Do While ii < (10 * B68)   '<< second number is number of ranges


        Set Rng = Cells(2, ii).Resize(, 10)
        For jj = 10 To 1 Step -1
            If Rng.Cells(jj) <> "" Then
               lc = Rng.Cells(jj).Column
                Exit For
                 Exit Do
            End If

        Next jj


'Find last non-blank series name
   ' Dim c
  '  For Each c In sh.Range(Cells(2, 6 + x), Cells(2, 6 + x).Offset(0, 9))
       ' If c = "" Then
       '  lc = c.column
        '    Exit For
     '   End If
   ' Next
 If lc = 0 Then lc = 9 + x

'Finding last row
With ActiveSheet.Range("E3").CurrentRegion
     LR = .Rows(.Rows.Count).Row
     LR = Range("E3:E" & LR).Find(vbNullString, , xlValues, xlWhole, xlByRows, xlNext).Row
 End With
'lr = 55

'Set range of data
If j = 1 Then
Set CHARTDATA = sh.Range(Cells(3, 6 + x).Address, Cells(LR, lc).Address)
Else
Set CHARTDATA = sh.Range(Cells(3, 6 + x).Address, Cells(LR, lc).Address)
End If

'Activate chart and make required changes
sh.ChartObjects("Cluster" & j).Activate
ActiveChart.ChartArea.Select
ActiveChart.SetSourceData Source:=CHARTDATA, PlotBy:=xlColumns
ActiveChart.ChartType = xlColumnClustered
ActiveChart.DisplayBlanksAs = xlNotPlotted
'ActiveChart.Axes(xlCategory).Select
'Selection.TickLabels.Orientation = 45
For i = 1 To ActiveChart.SeriesCollection.Count  'Headers to be added
Set cell1 = sh.Cells(2, 5 + i + x)

ActiveChart.SeriesCollection(i).Name = cell1.Value
Next i

ActiveChart.FullSeriesCollection(1).XValues = "='" & sh.Name & "'!" & "$E$3:$E$" & LR

If x > B68 * 10 Then
Exit Sub
End If
ii = ii + 10
x = x + 10
i = 0
j = j + 1
 Loop
End Sub
Code itself looks very complicated, but I guess problem is in CHARTDATA or SeriesCollection.
I am sharing expected result and sample workbook with hope someone can help me.