VBA to create multiple scatter plots with X and Y coordinates from different sheets

gfta123

New Member
Joined
Mar 31, 2021
Messages
2
Office Version
  1. 365
Platform
  1. MacOS
hi!

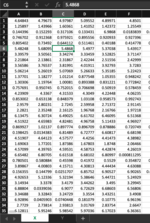
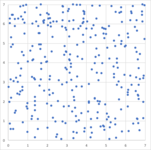
i need help creating a vba that will create approximately 500 scatter plots with X and Y coordinates located in different sheets. each column corresponds to a single scatter plot with 300 X and Y coordinates each. i then need to save these 500 scatter plots in a folder. ive been searching other threads but it seems that this has not been done yet.
 

Attachments

  • Screen Shot 2021-03-31 at 7.34.06 PM.png
    Screen Shot 2021-03-31 at 7.34.06 PM.png
    79.6 KB · Views: 14

Excel Facts

Will the fill handle fill 1, 2, 3?
Yes! Type 1 in a cell. Hold down Ctrl while you drag the fill handle.
just to add, the graphs must look like this. thanks!
 

Attachments

  • 1.png
    1.png
    15.8 KB · Views: 13
Upvote 0

Forum statistics

Threads
1,215,183
Messages
6,123,522
Members
449,103
Latest member
Michele317

We've detected that you are using an adblocker.

We have a great community of people providing Excel help here, but the hosting costs are enormous. You can help keep this site running by allowing ads on MrExcel.com.
Allow Ads at MrExcel

Which adblocker are you using?

Disable AdBlock

Follow these easy steps to disable AdBlock

1)Click on the icon in the browser’s toolbar.
2)Click on the icon in the browser’s toolbar.
2)Click on the "Pause on this site" option.
Go back

Disable AdBlock Plus

Follow these easy steps to disable AdBlock Plus

1)Click on the icon in the browser’s toolbar.
2)Click on the toggle to disable it for "mrexcel.com".
Go back

Disable uBlock Origin

Follow these easy steps to disable uBlock Origin

1)Click on the icon in the browser’s toolbar.
2)Click on the "Power" button.
3)Click on the "Refresh" button.
Go back

Disable uBlock

Follow these easy steps to disable uBlock

1)Click on the icon in the browser’s toolbar.
2)Click on the "Power" button.
3)Click on the "Refresh" button.
Go back
Back
Top