mclark1998
New Member
- Joined
- Jan 29, 2024
- Messages
- 1
- Office Version
- 365
- Platform
- Windows
- MacOS
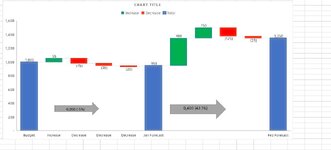
I am trying to put 2 data labels above waterfall bars. I attached an example - the chart already has the unit change, but I want to add the % change calculated in column D also. Any suggestions?
| Waterfall Example.xlsx | ||||||||||||||||||||||||||||
|---|---|---|---|---|---|---|---|---|---|---|---|---|---|---|---|---|---|---|---|---|---|---|---|---|---|---|---|---|
| A | B | C | D | E | F | G | H | I | J | K | L | M | N | O | P | Q | R | S | T | U | V | W | X | Y | Z | |||
| 1 | Waterfalls | |||||||||||||||||||||||||||
| 2 | Label | Units | % Change | |||||||||||||||||||||||||
| 3 | Budget | 1,000 | ||||||||||||||||||||||||||
| 4 | Increase | 55 | 79% | |||||||||||||||||||||||||
| 5 | Decrease | (75) | -107% | |||||||||||||||||||||||||
| 6 | Decrease | (30) | -43% | Current Actuals Change | ||||||||||||||||||||||||
| 7 | Decrease | (20) | -29% | -5% | (50) | -0,050 (-5%) | ||||||||||||||||||||||
| 8 | Jan Forecast | 950 | ||||||||||||||||||||||||||
| 9 | 400 | -100% | ||||||||||||||||||||||||||
| 10 | 150 | -38% | ||||||||||||||||||||||||||
| 11 | (125) | 31% | Current Forecast Change | |||||||||||||||||||||||||
| 12 | (25) | 6% | 42% | 400 | 0,400 (42.1%) | |||||||||||||||||||||||
| 13 | Feb Forecast | 1,350 | ||||||||||||||||||||||||||
| 14 | ||||||||||||||||||||||||||||
| 15 | ||||||||||||||||||||||||||||
| 16 | ||||||||||||||||||||||||||||
| 17 | ||||||||||||||||||||||||||||
| 18 | ||||||||||||||||||||||||||||
| 19 | ||||||||||||||||||||||||||||
| 20 | ||||||||||||||||||||||||||||
| 21 | ||||||||||||||||||||||||||||
| 22 | ||||||||||||||||||||||||||||
| 23 | ||||||||||||||||||||||||||||
| 24 | ||||||||||||||||||||||||||||
| 25 | ||||||||||||||||||||||||||||
| 26 | ||||||||||||||||||||||||||||
| 27 | ||||||||||||||||||||||||||||
| 28 | ||||||||||||||||||||||||||||
| 29 | ||||||||||||||||||||||||||||
Comparison 1 - 2 yr | ||||||||||||||||||||||||||||
| Cell Formulas | ||
|---|---|---|
| Range | Formula | |
| D4:D7 | D4 | =-B4/SUM($B$4:$B$7) |
| E7,E12 | E7 | =(B8-B3)/B3 |
| G7,G12 | G7 | =B8-B3 |
| H7 | H7 | =CONCATENATE(TEXT($G$7,"0,000")," (",ROUND($E$7,3)*100,"%)") |
| D9:D12 | D9 | =-B9/SUM($B$9:$B$12) |
| H12 | H12 | =CONCATENATE(TEXT($G$12,"0,000")," (",ROUND($E$12,3)*100,"%)") |