Generating a report based on a given condition access 2007

Enchantix

New Member
Joined
Sep 20, 2015
Messages
34
Hi All,

I have a table with the following columns that i wanted to report based on the shift colour the product was manufactured in but im not sure what statements to use for my query.

The shift colur relates to the 3rd character from the left of the Batch number, where B= Blue, K = Black, P = purple, and R = Red.

Date, Product, Product total, Sum of downgrades, Batch #, Downgrade 1, Downgrade2,..50
10/10 15CD 1398 4 PWB100 2 , 2 ,
10/10 15CD 1398 3 PWK107 1 , 2 ,
10/10 15CD 1398 10 PWP205 8 , 2 ,
15/10 17NS 744 8 PWB408 3 , 2 ,
15/10 17NS 744 11 PWR550 6 , 2 ,
15/10 17NS 744 12 PWR551 4 , 2 ,


Ive generated a query ( group by/ sum) to get a single row for each product and shift colour:

-used the MID function to get me the 3rd letter for the shift colour so i can group them.

- Used the total (by Max) for the product total to get it to a singe row for each product.

- summed the downgrades.

- Total falldown % = (sum of downgrades/Product total).


i just need my report to produce the following for each shift colour besides each other under the detail section based on the date inputs:

ie.

from 10/10/2016 to 15/10/2016

Label Header

Product: 15CD

Detail

Blue - B shift: Red-R shift: Black - Shift: Purple - P Shift

Total falldown: 0.3%

Product total: 1398

Top 5 downgrades
based on sum
(Transposed)

Downgrade 1 2

Downgrade 2 2

Downgrade 3 .

Downgrade 4 .

Downgrade 5 .


Product: 17NS

Detail

Blue - B Shift Red - R shift: Black shift , Purple Shift

Total falldown: 1.1% Total falldown: 3.1%

Product total: 744 Product total: 744

Top 5 downgrades Top 5 downgrades
based on sum based on sum
(transposed) (Transposed)

Downgrade 1 3 Downgrade 1 10

Downgrade 2 2 Downgrade 2 4

Downgrade 3 . Downgrade 3 .

Downgrade 4 . Downgrade 4 .

Downgrade 5 . Downgrade 5 .


If anyone has some guidance that will be greatly appreciated.


Kind regards
 

Excel Facts

Which lookup functions find a value equal or greater than the lookup value?
MATCH uses -1 to find larger value (lookup table must be sorted ZA). XLOOKUP uses 1 to find values greater and does not need to be sorted.
I don't get this statement for each shift colour besides each other under the detail section
You mean "beside" each other? Even then, still don't get it. You want the 'shift colors' to all be side by side? You want different detail fields to be side by side?
 
Upvote 0
I don't get this statement for each shift colour besides each other under the detail section
You mean "beside" each other? Even then, still don't get it. You want the 'shift colors' to all be side by side? You want different detail fields to be side by side?


Hello,

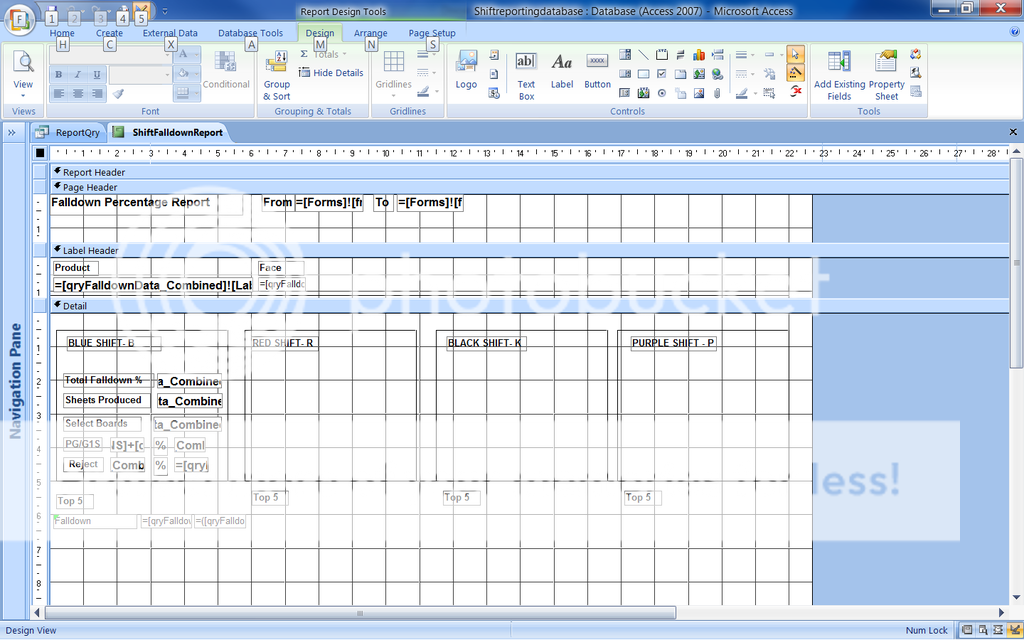
ive attached a couple of pictures highlighting what im trying to do.


In the first image below, you will see a report template where i have the shift colours beside each other with their corrosponding detail fields.


the second image below shows a query ive made which shows the details for my report


the second part of the report under the top 5 label would detail the top 5 downgrades based on the sum for each one for that particular shift colour.


thank you
Ibby
 
Upvote 0
So what are the boxes or frames in the report that surround the controls? If they are not subreport controls, they need to be. You'll need to break up your query into one for each shift, create a report for each shift and set each subcontrol to load each report. If you want top 5 data for each shift, that will have to be part of each individual report. If it is for overall, it has to be part of the main report and its query.

Another suggestion. You probably will or have found that From and To information in the report header is often not aligned properly, depending on the length of the date information. My preferred approach is to concatenate the dates and the to/from text into one textbox, such as
= "From " & Forms!.... & " To " & Forms!...


The frames are just ordinary lines acting as borders to the controls.

to break up the query for each shift colour, do i use criteria under each shiftcolour field (ie. where shift colour is "R")?


is it not possible to have the seperate shift colour results from the different queries in the one report?

how do i set up the top 5 downgrades in the report?


thank you for your quick response and much appreciated guidance.

Ibby
 
Upvote 0
Hope you don't mind if I use block caps within your quote so as to distinguish my answers
to break up the query for each shift colour, do i use criteria under each shiftcolour field (ie. where shift colour is "R")? YES
is it not possible to have the seperate shift colour results from the different queries in the one report? ONLY IF DISPLAYED IN ROWS, NOT COLUMNS
how do i set up the top 5 downgrades in the report? DEPENDS ON CHOICES PRESENTED IN 1ST PARAGRAPH, LAST TWO SENTENCES
 
Upvote 0
Hope you don't mind if I use block caps within your quote so as to distinguish my answers


sorry im still not clear on that last bit regarding the top 5 downgrades.


i currently have the sums calculated for each downgrade based on the product in each query for the 4 different shift colours (Red,Black, purple , Blue) .

There are around 20 different downgrades.

im not sure what setup to use in the report design so the the downgrades are listed in order based on the sum.

I.e.

top 5

Downgrade 2 20


Downgrade 6 15


Downgrade 3 12


Downgrade 15 10


Dwongrade 18 5


thanks
 
Upvote 0
A top n query is another animal altogether. If we're staying the course of having each shift as a subreport, it looks like your main report wouldn't bound to anything. I surmise that the textboxes in the label header area are being used as labels, which leads me to think your main report would not be bound to any data. So I'd say create a query that returns the top 5 for each shift and put one control/field underneath each subreport control for the respective shift. To make this work, I think you must sort by count(downgrade) descending. If you cannot do this in one query (I cannot see your source data) methinks you're looking at 5 top n queries (1 per shift) joined into a 6th query that presents each shift top 5 from left to right. Then you can use that query in the main report as noted.


ive made a query for each shift then ive combined and joined the 4 queries into the one query.

ive then generated a subreport for each shift based on that query and added it to the main report which is not bound to any data (just labels in the label header)

regarding thetop 5 setup.


my data is in a series of columns, as in i have a column for each downgrade type from downgrade 1 to downgrade 20 with the value in each row based on the date, product and shift colour.


i get the sort by count descending part but how do i apply it to the query for each downgrade 1 to 20? do i add all the downgrades to the query and select sort descending? and what would the control statement contain for it to display the different downgrades. furthermore can i transpose that control field so that it displays the downgrades from top to bottom instead from left to right?

many thanks,
ibby
 
Upvote 0
Not sure you caught my meaning since a sub report has it's own query, thus you should have a separate query for each, not combine them into one.

I think you'll have to post a sample of your data, but please don't use your prior method with lots of row spacing in between. Put it in Excel, ensure the columns fit your data, and dump a sample in a post. You'll get a nicely laid out table. The fact that your data is in columns is not conducive to how data is supposed to be stored in a database, so that may be problematic. It should be in rows.
 
Upvote 0

Forum statistics

Threads
1,214,984
Messages
6,122,601
Members
449,089
Latest member
Motoracer88

We've detected that you are using an adblocker.

We have a great community of people providing Excel help here, but the hosting costs are enormous. You can help keep this site running by allowing ads on MrExcel.com.
Allow Ads at MrExcel

Which adblocker are you using?

Disable AdBlock

Follow these easy steps to disable AdBlock

1)Click on the icon in the browser’s toolbar.
2)Click on the icon in the browser’s toolbar.
2)Click on the "Pause on this site" option.
Go back

Disable AdBlock Plus

Follow these easy steps to disable AdBlock Plus

1)Click on the icon in the browser’s toolbar.
2)Click on the toggle to disable it for "mrexcel.com".
Go back

Disable uBlock Origin

Follow these easy steps to disable uBlock Origin

1)Click on the icon in the browser’s toolbar.
2)Click on the "Power" button.
3)Click on the "Refresh" button.
Go back

Disable uBlock

Follow these easy steps to disable uBlock

1)Click on the icon in the browser’s toolbar.
2)Click on the "Power" button.
3)Click on the "Refresh" button.
Go back
Back
Top