kalcerro_1
New Member
- Joined
- Feb 28, 2020
- Messages
- 27
- Office Version
- 365
- Platform
- Windows
Hello Everyone!
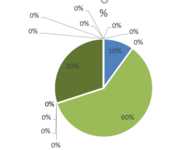
I have two graphics that are auto-generated when a tab appears in the excel workbook (appears generated by a macro runned by the user). These graphics will have sometimes values in Zero, values without any results, but somehow, these zeros always appear in the graphic, I have tried with different methods, advanced options in excel workbooks, changing the values in the data, using the if formula, but the zeros always appear in the data label. Picture attached of what I'm getting.
Is there a method, not using pivot tables, that can help me to hide automatic these zeros?
Best regards,
Karin.