Combo chart - series 2 overlaps/blocks series 1

sgcannon

Board Regular
Joined
Jan 28, 2016
Messages
56
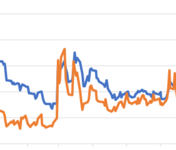
I want the blue line (series 1) to overlap orange (series 2) instead of vice versa. Series 1 is the more important of the two data sets.

I suppose I could redo all my charts and switch the series 1 for series 2 but that would take forever.

Thanks!

Steve
 

Attachments

  • Screenshot (3).png
    Screenshot (3).png
    14 KB · Views: 5

Excel Facts

How can you automate Excel?
Press Alt+F11 from Windows Excel to open the Visual Basic for Applications (VBA) editor.

Forum statistics

Threads
1,215,731
Messages
6,126,539
Members
449,316
Latest member
sravya

We've detected that you are using an adblocker.

We have a great community of people providing Excel help here, but the hosting costs are enormous. You can help keep this site running by allowing ads on MrExcel.com.
Allow Ads at MrExcel

Which adblocker are you using?

Disable AdBlock

Follow these easy steps to disable AdBlock

1)Click on the icon in the browser’s toolbar.
2)Click on the icon in the browser’s toolbar.
2)Click on the "Pause on this site" option.
Go back

Disable AdBlock Plus

Follow these easy steps to disable AdBlock Plus

1)Click on the icon in the browser’s toolbar.
2)Click on the toggle to disable it for "mrexcel.com".
Go back

Disable uBlock Origin

Follow these easy steps to disable uBlock Origin

1)Click on the icon in the browser’s toolbar.
2)Click on the "Power" button.
3)Click on the "Refresh" button.
Go back

Disable uBlock

Follow these easy steps to disable uBlock

1)Click on the icon in the browser’s toolbar.
2)Click on the "Power" button.
3)Click on the "Refresh" button.
Go back
Back
Top