Joneye
Well-known Member
- Joined
- May 28, 2010
- Messages
- 777
- Office Version
- 365
- 2019
- Platform
- Windows
- MacOS
Hi there,
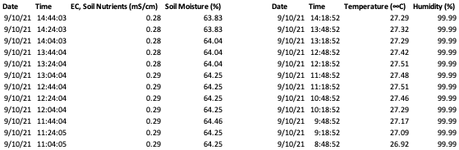
Im looking to plot a graph to display Date & Time on an X axis then Soil Nutrients, Soil Moisture then Temperature & Humidity on the Y Axis. Im completely stumped if its.
A. Possible
B, If it is what web links can i follow that have achieved this before
C. Is there another method of displaying this


Im looking to plot a graph to display Date & Time on an X axis then Soil Nutrients, Soil Moisture then Temperature & Humidity on the Y Axis. Im completely stumped if its.
A. Possible
B, If it is what web links can i follow that have achieved this before
C. Is there another method of displaying this