Creating a Phasor (Quadrant) diagram (chart)

BillV

New Member
Joined
Jun 19, 2003
Messages
38
Can someone provide step by step instructions for how to make a Phasor (Quadrant) diagram (chart) like the screen shot below? This is 360° chart, that should rotate counterclockwise. V1 will always be at 0°.
Here is the data for the attached chart:
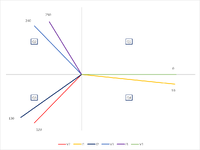
V1=0°
I1=10°
V2=120
I2=130°
V3=240°
I3=250°

Phasor diagram.jpg
 
I probably didn't explain this well enough. This is a 360 phasor that counts clockwise but the vectors rotate counter-clockwise. And so, if the I1 angle is 10° then it lags V1 but if I1 is at 330° then it leads V1.
Since these are voltage and current (amp) vectors:
V1 is expected to always be at 0°
The I1 angle is always measured in relation to V1
The I2 angle is always measured in relation to V2 and will normally lag V2 but it's possible to lead under certain conditions. V2 will always be at either 120° or 240°.
The I3 angle is always measured in relation to V3 and will normally lag V3 but it's possible to lead under certain conditions. V3 will always be at either 120° or 240° but never the same as V2.


Phasor diagram 002.jpg
 
Upvote 0

Excel Facts

Which came first: VisiCalc or Lotus 1-2-3?
Dan Bricklin and Bob Frankston debuted VisiCalc in 1979 as a Visible Calculator. Lotus 1-2-3 debuted in the early 1980's, from Mitch Kapor.
The screen shot I provided is from an instrument but I'd like to build a spreadsheet as a verification and training tool.
 
Upvote 0
I probably didn't explain this well enough. This is a 360 phasor that counts clockwise but the vectors rotate counter-clockwise. And so, if the I1 angle is 10° then it lags V1 but if I1 is at 330° then it leads V1.
Since these are voltage and current (amp) vectors:
V1 is expected to always be at 0°
The I1 angle is always measured in relation to V1
The I2 angle is always measured in relation to V2 and will normally lag V2 but it's possible to lead under certain conditions. V2 will always be at either 120° or 240°.
The I3 angle is always measured in relation to V3 and will normally lag V3 but it's possible to lead under certain conditions. V3 will always be at either 120° or 240° but never the same as V2.
I asked for this in post#2 but didn't get an answer. The formula is currently always measuring the angle from V1 counterclockwise. If you want clockwise, then take the complement of 360.

Book1
ABCDEFG
1rdegx_originxy_originy
2V150050-1.22515E-15
3I151004.924038770-0.868240888
4V251200-2.50-4.330127019
5I251300-3.213938050-3.830222216
6V352400-2.504.330127019
7I352500-1.7101007204.698463104
Sheet1
Cell Formulas
RangeFormula
E2:E7E2=B2*COS(RADIANS(360-C2))
G2:G7G2=B2*SIN(RADIANS(360-C2))
 
Upvote 0
Adding radian's has matched the voltage and current vectors correctly but with the angles that I've provided voltage should be leading current in all three phases. Plus, V1 I1 should be in the 1st quadrant, V2 I2 should be in the 2nd quadrant and V3 I3 should be in the 3rd quadrant. The 4th quadrant should be empty.

Is it possible to remove the "r" numerals on the chart, add the 360 phasor numbers and add the quadrant numbers to each section?


Phasor diagram 003.jpg
 
Upvote 0
Adding radian's has matched the voltage and current vectors correctly but with the angles that I've provided voltage should be leading current in all three phases. Plus, V1 I1 should be in the 1st quadrant, V2 I2 should be in the 2nd quadrant and V3 I3 should be in the 3rd quadrant. The 4th quadrant should be empty. - See post #13.

Is it possible to remove the "r" numerals on the chart, - Click on the axis -> Axis Options -> label position -> none

...add the 360 phasor numbers and - Click on each chart -> Add data labels -> Label options -> Value from cell -> Select the phasor numbers

add the quadrant numbers to each section? - Create additional points below and add to the charts. The labels are the same as the 360 phasor.


Book1
ABCDEFG
1rdegx_originxy_originy
2V150050-1.22515E-15
3I151004.9240387650-0.868240888
4V251200-2.50-4.330127019
5I251300-3.2139380480-3.830222216
6V352400-2.504.330127019
7I352500-1.71010071704.698463104
8
9
10quadrants labelsxy
11Q42.52.5
12Q3-2.52.5
13Q2-2.5-2.5
14Q12.5-2.5
Sheet1
Cell Formulas
RangeFormula
E2:E7E2=B2*COS(RADIANS(360-C2))
G2:G7G2=B2*SIN(RADIANS(360-C2))
B13B13=-2.5


1710880682486.png
 

Attachments

  • 1710880291280.png
    1710880291280.png
    23 KB · Views: 2
Last edited:
Upvote 0
My apologies for not being clear.
I've added 360 to the formula and that has corrected the current to lag and placed the vectors in the correct quadrant.

Phasor diagram 004.jpg
 
Upvote 0
Do you have an idea why the quadrants labels are catching the Y coordinate and not the series name?

Phasor diagram 005.jpg
 
Upvote 0
By default, the labels are set to x-value. You can change it.

1710883100506.png
 
Upvote 0

Forum statistics

Threads
1,215,069
Messages
6,122,954
Members
449,095
Latest member
nmaske

We've detected that you are using an adblocker.

We have a great community of people providing Excel help here, but the hosting costs are enormous. You can help keep this site running by allowing ads on MrExcel.com.
Allow Ads at MrExcel

Which adblocker are you using?

Disable AdBlock

Follow these easy steps to disable AdBlock

1)Click on the icon in the browser’s toolbar.
2)Click on the icon in the browser’s toolbar.
2)Click on the "Pause on this site" option.
Go back

Disable AdBlock Plus

Follow these easy steps to disable AdBlock Plus

1)Click on the icon in the browser’s toolbar.
2)Click on the toggle to disable it for "mrexcel.com".
Go back

Disable uBlock Origin

Follow these easy steps to disable uBlock Origin

1)Click on the icon in the browser’s toolbar.
2)Click on the "Power" button.
3)Click on the "Refresh" button.
Go back

Disable uBlock

Follow these easy steps to disable uBlock

1)Click on the icon in the browser’s toolbar.
2)Click on the "Power" button.
3)Click on the "Refresh" button.
Go back
Back
Top