Creating Auto Updating Charts

Greencells

New Member
Joined
Sep 12, 2023
Messages
2
Office Version
  1. 2021
Platform
  1. MacOS
Hello,

I'm looking for some thoughts/suggestions on the best way to create a series of auto-updating charts.
Previously I'd done the time consuming work of extracting via links (referenced cells) on a separate sheet but I'd like to see if I could do it agains the source data.

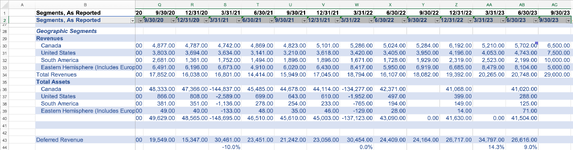
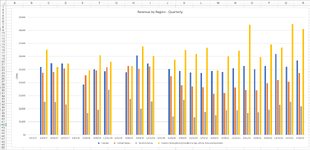
Effectively I have a very large sheet of raw financial statement data and calculations organized as seen in the images. Basically Quarters then Annual figures.
Since this is effectively a standard template I'd ideally like to create the graphs on separate sheet(s) I've tried to convert the data to an Excel Table then use Table references to create a dynamic chart.
I've tried to create an automated chart using an Excel table however when I add new data (e.g. I'll typically insert a new Column in the middle of the selection to enter the most recent quarter) it is not being picked up.

Any thoughts on the correct approach I'd prefer to utilize Excel's Table functions vs. adding extract complexity via using an Offset formula since I could have 15-20 standard charts?

For background I'm using Excel 2021 v16.76 on an intel Mac running Ventura 13.5

Thanks in advance.
 

Attachments

  • Screenshot 2023-09-12 at 7.42.07 PM.png
    Screenshot 2023-09-12 at 7.42.07 PM.png
    205 KB · Views: 10
  • Screenshot 2023-09-12 at 7.42.26 PM.png
    Screenshot 2023-09-12 at 7.42.26 PM.png
    72.4 KB · Views: 11

Excel Facts

Does the VLOOKUP table have to be sorted?
No! when you are using an exact match, the VLOOKUP table can be in any order. Best-selling items at the top is actually the best.
I'm not a formula guy so can't help you solve this with a formula - at least not if you're inserting columns. My thoughts on the issue is to use dynamic Named Ranges for your chart series. However, I have made them dynamic based on data added to rows but not to cover the scenario when someone inserts columns within a chart series range if that's what you're doing. So if one series used column B and another uses C but you shift C over because you insert a column I don't know how to handle that with a dynamic named range (I'm guessing that the B series would pick up your inserted column). My suggestion is based on that happening and the result that at least one chart series ends up looking at the wrong column.

The only way I can think of covering that scenario is if you used column headers. Then using vba code you could rebuild the range .RefersTo property so that your B series looks at column C if that's where the header gets moved to. I have done some Excel vba coding but so far have not delved into identifying a column by header values (should not be too difficult) and have not tried to edit range .RefersTo properties.
 
Upvote 0
Micron,

I appreciate you taking time to reply. Yes the solution you're putting forward works and traditionally I solved this using a whole lot of Offset functions which fed the charts - this could be done as Named Ranges or directly in the Chart dialog box.

Here is the solution I ultimately came up with after a bunch of trail and error - I'll leave this here in case someone is searching the web for a similar problem.
Using Power Query I was able to import the data from the source data sheet I was then able to manipulate the data by removing unwanted rows with "null" values. Once I was satisfied with the source data I then went to the Transpose tab on the ribbon and clicked on Transpose which swapped the values. You can then do further cleaning on the data when I was satisfied I closed/saved the query and sent it to a new worksheet in Excel. I was then able to create a dynamic chart using the data in the Excel Table sent back from the query.

Thanks again.
 
Upvote 0
Solution

Forum statistics

Threads
1,215,069
Messages
6,122,959
Members
449,096
Latest member
Anshu121

We've detected that you are using an adblocker.

We have a great community of people providing Excel help here, but the hosting costs are enormous. You can help keep this site running by allowing ads on MrExcel.com.
Allow Ads at MrExcel

Which adblocker are you using?

Disable AdBlock

Follow these easy steps to disable AdBlock

1)Click on the icon in the browser’s toolbar.
2)Click on the icon in the browser’s toolbar.
2)Click on the "Pause on this site" option.
Go back

Disable AdBlock Plus

Follow these easy steps to disable AdBlock Plus

1)Click on the icon in the browser’s toolbar.
2)Click on the toggle to disable it for "mrexcel.com".
Go back

Disable uBlock Origin

Follow these easy steps to disable uBlock Origin

1)Click on the icon in the browser’s toolbar.
2)Click on the "Power" button.
3)Click on the "Refresh" button.
Go back

Disable uBlock

Follow these easy steps to disable uBlock

1)Click on the icon in the browser’s toolbar.
2)Click on the "Power" button.
3)Click on the "Refresh" button.
Go back
Back
Top