Is there a way to solve this problem?

Joined
Jun 15, 2023
Messages
3
Office Version
  1. 365
  2. 2021
  3. 2019
Platform
  1. Windows
Dear all,

I have a huge problem and a huge excel file of thousands of rows of information.

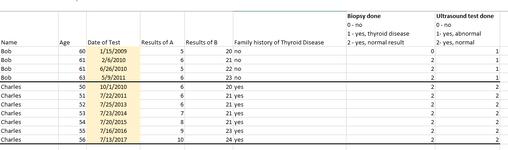
There are many "participants" with test results taken on different dates. Each participant can have multiple test done on different dates and these are all listed in multiple rows. Each participant is separated by a thick line.

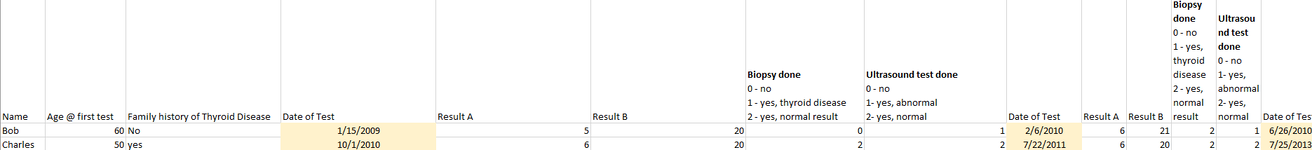
I need each participant and their results all in 1 row instead of multiple rows. This is also to say, if i had 1000 participants, i wish to have 1000 rows, each row is a unique patient, unlike what it is now.

An example of my nightmare is attached in 1 image, and the ideal end result in the 2nd image.

Question:
-Is there a way or do i need to do it manually? I don't think the transpose functions will work well.
-For those well versed with statistical analysis, whether R or SPSS, is it better to have 1 unique patient's result all in 1 row instead of what it is now?

Thank you


EDIT:
The results from the least recent from left to the most recent to the right
 

Attachments

  • image 1.PNG
    image 1.PNG
    24 KB · Views: 11
  • image 2.PNG
    image 2.PNG
    19.4 KB · Views: 10
Last edited by a moderator:

Excel Facts

Excel Can Read to You
Customize Quick Access Toolbar. From All Commands, add Speak Cells or Speak Cells on Enter to QAT. Select cells. Press Speak Cells.
@CluelessFellowExcelor, welcome to the Forum.

Why?
Is it about data entry or data retrieval or both?
It is more for data analysis, i find it easier to run statistical analysis when all results for 1 subject is in 1 row.

For instance and using the images as an example, it's easier for me to code on excel measurements such as -- total blood tests done, total duration of follow up (first blood test to last blood test result)
 
Upvote 0
have you thought of using Access?

you can then get your results using simple queries
 
Upvote 0
It is more for data analysis, i find it easier to run statistical analysis when all results for 1 subject is in 1 row.

For instance and using the images as an example, it's easier for me to code on excel measurements such as -- total blood tests done, total duration of follow up (first blood test to last blood test result)
By "to code on excel measurements", you mean you do it with macro instead of formula, right?
I don't see why setting up 1 subject in 1 row will make it easier to code. Can you elaborate?
 
Upvote 0
It is more for data analysis, i find it easier to run statistical analysis when all results for 1 subject is in 1 row.

For instance and using the images as an example, it's easier for me to code on excel measurements such as -- total blood tests done, total duration of follow up (first blood test to last blood test result)

Hm

I typically have been making simple calculations using formulas.

1. In my mind, should i wish to calculate total follow-up time for subject "Bob" (determined by difference in time between first test A and last testA), I could create a formula for the difference in time between the two dates. But this manual formula cannot be copy and pasted / dragged down for "Charles" as the formula won't be able to calculate for each specific subject. If I had the results in 1 row for 1 subject, i could create a column for a formula to search for the first test date and another column for last test date, then a formula for the difference between the two, and then the formula can be dragged down for each subject in each row.

2. Another test i am thinking of, using the images again as an example, is to assess numerical trend of test A & B result. Result A / B can fluctuate, trend upwards or trend downwards for instance. In my mind, i think having the results all in 1 row can be easier for me to code a formula to indicate if the subject belongs to "uptrend group" "downtrend group" "stagnant group" "fluctuate group". For instance, if all test A/B result values go up, then formulate into the uptrend group, so and and so forth. If there are multiple results for 1 subject in different rows, I'm not capable of coding "manuallly".
 
Upvote 0
Alright, I'll try to write a macro to turn your data into 1 subject in 1 row.

1. Can you post your example using the xl2bb tool?

2. What is the maximum number of rows a subject can have in your existing data?

3. I suggest you create a unique ID for each subject, don't rely on names because different people can have the same name.
 
Upvote 0

Forum statistics

Threads
1,215,094
Messages
6,123,071
Members
449,092
Latest member
ipruravindra

We've detected that you are using an adblocker.

We have a great community of people providing Excel help here, but the hosting costs are enormous. You can help keep this site running by allowing ads on MrExcel.com.
Allow Ads at MrExcel

Which adblocker are you using?

Disable AdBlock

Follow these easy steps to disable AdBlock

1)Click on the icon in the browser’s toolbar.
2)Click on the icon in the browser’s toolbar.
2)Click on the "Pause on this site" option.
Go back

Disable AdBlock Plus

Follow these easy steps to disable AdBlock Plus

1)Click on the icon in the browser’s toolbar.
2)Click on the toggle to disable it for "mrexcel.com".
Go back

Disable uBlock Origin

Follow these easy steps to disable uBlock Origin

1)Click on the icon in the browser’s toolbar.
2)Click on the "Power" button.
3)Click on the "Refresh" button.
Go back

Disable uBlock

Follow these easy steps to disable uBlock

1)Click on the icon in the browser’s toolbar.
2)Click on the "Power" button.
3)Click on the "Refresh" button.
Go back
Back
Top