meto343
New Member
- Joined
- Jul 1, 2022
- Messages
- 11
- Office Version
- 365
- Platform
- Windows
Hello,
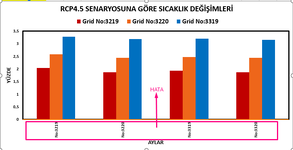
My macro code throws an error when there are less than 5 values in the x-axis of the table.
I want to convert the following table to chart (grafik getir means get the chart in Turkish):


The X-axis and the grid part swap places, it only does so when it's less than 5. Other than that it works as it should.
The graph should be looking like this:

Thank you for your help in advance.
The code:
The File:
Other topics: Macro Error at Specific Range
My macro code throws an error when there are less than 5 values in the x-axis of the table.
I want to convert the following table to chart (grafik getir means get the chart in Turkish):
The X-axis and the grid part swap places, it only does so when it's less than 5. Other than that it works as it should.
The graph should be looking like this:
Thank you for your help in advance.
The code:
VBA Code:
Sub grafiksicaklikyapcolumn()
Dim grafik As Object, rg As Range
Dim adres As String
On Error Resume Next
adres = Selection.Address(0, 0)
If InStr(1, adres, ":") = 0 Then Exit Sub


Set rg = Sheet1.Range(adres)
satir = rg.Row
sutun = rg.Column

baslik = Sheet1.Cells(satir - 2, sutun + 2) & " " & "SENARYOSUNA GÖRE" & " " & "SICAKLIK DEĞİŞİMLERİ"
YAN = "YÜZDE"

  Set grafik = Sheet1.Shapes.AddChart2

With grafik.Chart
  .SetSourceData rg
  .ChartType = xlColumnClustered
  .ChartTitle.Text = baslik
  .HasLegend = True
  .Legend.TickLabels.Font.Size = 50
  .Legend.Font.ColorIndex = 1
  .Legend.Font.Weight = 12
  .Legend.Font.Size = 18
  .Legend.Font.Bold = True
  .ChartTitle.Font.Bold = True
  .ChartTitle.Font.Size = 22
  .ChartTitle.Font.ColorIndex = 1
 With .PlotArea.Border
 .LineStyle = xlContinuous
 .Weight = xlThick
 End With

  .PlotArea.Format.Line.ForeColor.ObjectThemeColor = msoThemeColorText1

  .Legend.Position = xlLegendPositionTop
  .Axes(xlValue).HasTitle = True
  .Axes(xlValue).AxisTitle.Text = YAN
  .Axes(xlValue).AxisTitle.Font.Bold = True
  .Axes(xlValue).AxisTitle.Font.Size = 16
  .Axes(xlValue).AxisTitle.Font.ColorIndex = 1
  .Axes(xlValue).MajorGridlines.Delete
  .Axes(xlValue).Labels.Font.ColorIndex = 1
  .Axes(xlCategory).HasTitle = True
  .Axes(xlCategory).AxisTitle.Text = "AYLAR"
  .Axes(xlCategory).AxisTitle.Font.Bold = True
  .Axes(xlCategory).AxisTitle.Font.Size = 16
  .Axes(xlCategory).AxisTitle.Font.ColorIndex = 1
   .Axes(xlCategory).Font.Weight = Bold
    .Axes(xlCategory).TickLabels.Orientation = xlUpward
    .Axes(xlCategory).TickLabelPosition = xlLow

  .Axes(xlValue).TickLabels.Font.Size = 12
  .Axes(xlValue).TickLabels.Font.Bold = msoTrue
  .Axes(xlValue).TickLabels.Font.Color = RGB(0, 0, 0)

   .Axes(xlCategory).TickLabels.Font.Size = 12
   .Axes(xlCategory).TickLabels.Font.Bold = msoTrue
   .Axes(xlCategory).TickLabels.Font.Color = RGB(0, 0, 0)
  .Axes(xlCategory).TickLabels.Format.Line.Weight = 2.5
  .Axes(xlCategory).TickLabels.Format.Line.ForeColor.RGB = RGB(255, 130, 5)

    .FullSeriesCollection(1).Interior.Color = RGB(192, 0, 0)
    .FullSeriesCollection(2).Interior.Color = RGB(238, 102, 26)
    .FullSeriesCollection(3).Interior.Color = RGB(0, 112, 192)
    .FullSeriesCollection(4).Interior.Color = RGB(56, 87, 35)


    .SeriesCollection(1).Name = "Grid " & Sheet1.Cells(satir, sutun + 1)
    .SeriesCollection(2).Name = "Grid " & Sheet1.Cells(satir, sutun + 2)
    .SeriesCollection(3).Name = "Grid " & Sheet1.Cells(satir, sutun + 3)
    .SeriesCollection(4).Name = "Grid " & Sheet1.Cells(satir, sutun + 4)


    .PlotArea.Format.Line.ForeColor.ObjectThemeColor = msoThemeColorText1
  End With

grafik.Width = 800
grafik.Height = 400
    grafik.Left = Sheet1.Cells(5 + satir, sutun).Left
    grafik.Top = Sheet1.Cells(5 + satir, sutun).Top


Set grafik = Nothing
 MsgBox "Graph is Ready!", vbInformation, "YAY!"

End Sub
The File:
Other topics: Macro Error at Specific Range