Plotting multiple points on the same column depending on a unique value

eddienice

New Member
Joined
Apr 7, 2017
Messages
3
Hi,

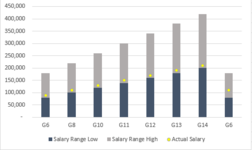
Data Below: Hopefully the title is not too confusing, but I'm trying to create a bar chart to show salary ranges and the actual salary showing up as a plot. However, when I build a chart it will keep adding as an additional column when I'd just like the actual salary to be plotted as "grade 6".

GradeSalary Range LowSalary Range HighActual Salary
G680,000100,00090,000
G8100,000120,000110,000
G10120,000140,000130,000
G11140,000160,000150,000
G12160,000180,000170,000
G13180,000200,000190,000
G14200,000220,000210,000
G680,000100,000110,000
 

Attachments

  • Test.PNG
    Test.PNG
    10.2 KB · Views: 3

Excel Facts

Spell Check in Excel
Press F7 to start spell check in Excel. Be careful, by default, Excel does not check Capitalized Werds (whoops)

Forum statistics

Threads
1,216,066
Messages
6,128,568
Members
449,458
Latest member
gillmit

We've detected that you are using an adblocker.

We have a great community of people providing Excel help here, but the hosting costs are enormous. You can help keep this site running by allowing ads on MrExcel.com.
Allow Ads at MrExcel

Which adblocker are you using?

Disable AdBlock

Follow these easy steps to disable AdBlock

1)Click on the icon in the browser’s toolbar.
2)Click on the icon in the browser’s toolbar.
2)Click on the "Pause on this site" option.
Go back

Disable AdBlock Plus

Follow these easy steps to disable AdBlock Plus

1)Click on the icon in the browser’s toolbar.
2)Click on the toggle to disable it for "mrexcel.com".
Go back

Disable uBlock Origin

Follow these easy steps to disable uBlock Origin

1)Click on the icon in the browser’s toolbar.
2)Click on the "Power" button.
3)Click on the "Refresh" button.
Go back

Disable uBlock

Follow these easy steps to disable uBlock

1)Click on the icon in the browser’s toolbar.
2)Click on the "Power" button.
3)Click on the "Refresh" button.
Go back
Back
Top