adriandwor
New Member
- Joined
- Sep 7, 2021
- Messages
- 19
- Office Version
- 2016
- Platform
- Windows
Hey guys,
Is there a way in excel to plot segments as horizontal lines? I'd like it to resemble a type of a stock chart but without the closing values. I have data that involves different trips with starting time and ending time.
I'd like to be able to plot it as shown below:

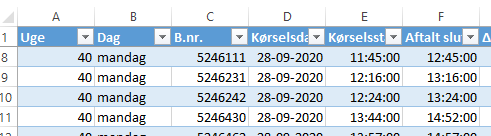
The Data looks like this and has about 5000 data points that can be subdivided into weeks with about 100 rows each:
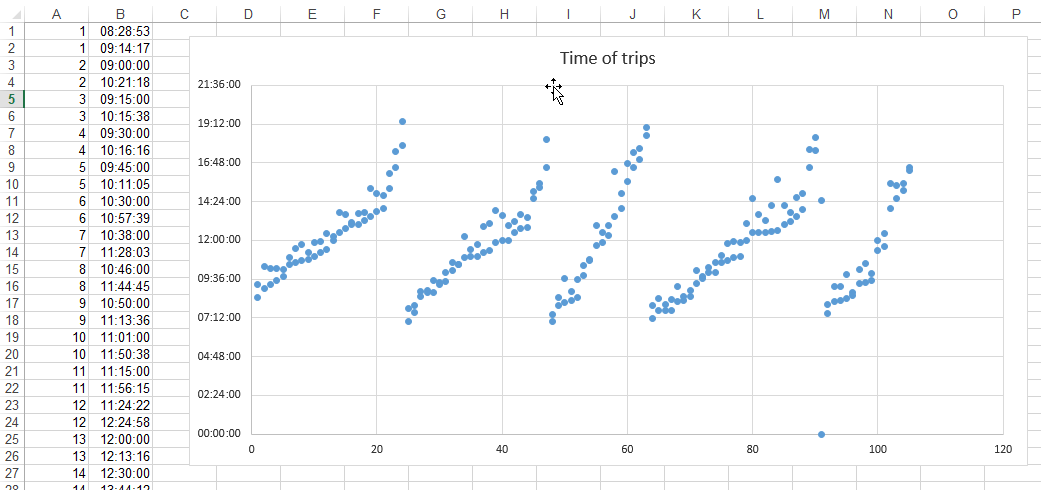
I have tried a scatter chart like this, but it takes a bit of time to do modification work and I can't seem to find out how to draw horizontal lines between 2 points.
Thanks a lot for your time and also answers to the previous questions
I
Is there a way in excel to plot segments as horizontal lines? I'd like it to resemble a type of a stock chart but without the closing values. I have data that involves different trips with starting time and ending time.
I'd like to be able to plot it as shown below:
The Data looks like this and has about 5000 data points that can be subdivided into weeks with about 100 rows each:
I have tried a scatter chart like this, but it takes a bit of time to do modification work and I can't seem to find out how to draw horizontal lines between 2 points.
Thanks a lot for your time and also answers to the previous questions
I
")


