Price analysis

Status
Not open for further replies.

s_balasubramanian

New Member
Joined
Feb 7, 2022
Messages
8
Office Version
  1. 2019
  2. 2016
  3. 2013
Platform
  1. Windows
Hai.

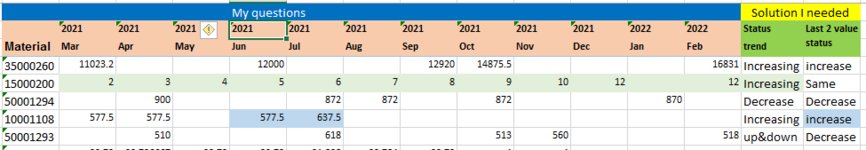
Im working in purchase department and analyzing Price/Rate of our purchased product as listed below. (image also attached)
Based on the data i want to know this prices are ""Increasing / Decreasing / Up & Down" (Status column)
Also i want to compare last two rate to find that are "Same / Increase / Decrease (Last 2 value status)

Refer last two column in image or Table the result which i want

I have this price data in MS office XL 2013

Please support to provide coding for this.

Thanks
S.Balasubramanian
TN, INDIA


202120212021202120212021202120212021202120222022StatusLast 2 value status
MaterialMarAprMayJunJulAugSepOctNovDecJanFebtrend
35000260
11023.2​
12000​
12920​
14875.5​
16831​
Increasingincrease
15000200
2​
3​
4​
5​
6​
7​
8​
9​
10​
12​
12​
IncreasingSame
50001294
900​
872​
872​
872​
870​
DecreaseDecrease
10001108
577.5​
577.5​
577.5​
637.5​
Increasingincrease
50001293
510​
618​
513​
560​
518​
up & downDecrease
 

Attachments

  • xlhelp.PNG
    xlhelp.PNG
    13.9 KB · Views: 6

Excel Facts

Excel Wisdom
Using a mouse in Excel is the work equivalent of wearing a lanyard when you first get to college
xl excel help.xlsx
WXYZAAABACADAEAFAGAHAIAJAK
1My questionsSolution I needed
2202120212021202120212021202120212021202120222022StatusLast 2 value status
3MaterialMarAprMayJunJulAugSepOctNovDecJanFebtrend
43500026011023.2120001292014875.516831Increasingincrease
51500020023456789101212IncreasingSame
650001294900872872872870DecreaseDecrease
710001108577.5577.5577.5637.5Increasingincrease
850001293510618513560518up&downDecrease
last NTH value
 
Upvote 0
last 2 values : 1st value/2nd value = 95-105% = same, >105% = increase, <95% = decrease
status trend : an UDF (with VBA)
Map2
ABCDEFGHIJKLMNOPQRS
1My questionsSolution I needed
2202120212021202120212021202120212021202120222022StatusLast 2 value status0,00%increase
3MaterialMarAprMayJunJulAugSepOctNovDecJanFebtrendjoined95,00%same
43500026011023,2120001292014875,516831Increasingincrease11023,2;12000;12920;14875,5;16831105,00%decrease
51500020023456789101212Increasingsame2;3;4;5;6;7;8;9;10;12;12
650001294900872872872870Decreasesame900;872;872;872;870
710001108577,5577,5577,5637,5Increasingincrease577,5;577,5;577,5;637,5
850001293510618513560518up&downdecrease510;618;513;560;518
9 
Blad3
Cell Formulas
RangeFormula
O4:O8O4=VLOOKUP(OFFSET($A4,,LARGE(COLUMN($B4:$M4)*(B4:M4<>""),2)-1,,)/OFFSET($A4,,LARGE(COLUMN($B4:$M4)*(B4:M4<>""),1)-1,,),$R$2:$S$4,2,1)
P4:P9P4=TEXTJOIN(";",1,B4:M4)
 
Upvote 0
just checking if a VBA-solution is allowed !

column O = monthly change in price for the last 2 values, for example row 4 = +13% between both values but 4 months interval = +13% / 4 = +3.1% / month
column N = see regression in P
for example row 4 = 10605,11 +541,63 * Month (R2=0,94) = meaning if you make a line through the data, month 0 = march 2021 has value 10.605 and every month 541 is added to that value.
R2 is a measure for fiability, .94 is very good. Because you add a value every month = increase.
Row 8 ---> R2 =0.02 = very low, you can't say anything about "up or down"

VBA Code:
Sub linestt()
     arr = Range("B1:M9")
     For r = 4 To 8
          ptr = 0
          ReDim y(UBound(arr, 2))
          ReDim x(UBound(y))
          For j = 1 To UBound(arr, 2)
               If arr(r, j) <> "" Then
                    x(ptr) = j - 1                              'arr(9, j)
                    y(ptr) = arr(r, j)
                    ptr = ptr + 1
               End If
          Next
          ReDim Preserve y(ptr - 1)
          ReDim Preserve x(UBound(y))
          Range("N" & r).Resize(, 3).ClearContents

          If ptr >= 1 Then
               l2 = (y(UBound(y)) / y(UBound(y) - 1) - 1) / (x(UBound(x)) - x(UBound(x) - 1))

               a = WorksheetFunction.LinEst(y, x, , 1)
               Range("N" & r).Resize(, 3).Value = Array(IIf(a(3, 1) < 0.1, "up-down", IIf(a(1, 1) > 0, "Increase", "Decrease")), l2, Format(a(1, 2), "0.00") & IIf(a(1, 1) > 0, " +", " ") & Format(a(1, 1), "0.00") & " * Month (R2=" & Format(a(3, 1), "0.00\)"))
          End If
     Next
End Sub
priceanalysis.xlsm
ABCDEFGHIJKLMNOP
1My questionsSolution I needed
2202120212021202120212021202120212021202120222022StatusLast 2 value status
3MaterialmaaAprmeiJunJulAugSepoktNovDecJanFebtrend
43500026011023,2120001292014875,516831Increase+3,3%10605,11 +541,63 * Month (R2=0,94)
51500020023456789101212Increase+9,1%2,17 +0,95 * Month (R2=0,98)
650001294900872872872870Decrease-0,1%893,02 -2,93 * Month (R2=0,59)
710001108577,5577,5577,5637,5Increase+10,4%568,50 +12,00 * Month (R2=0,53)
850001293510618513560518up-down-2,5%555,06 -1,82 * Month (R2=0,02)
9
1001234567891011
Blad3
Cell Formulas
RangeFormula
B10:M10B10=COLUMN()-2
 
Upvote 0
Result of "Last 2 value status" is working
i am happy.

also your second suggestion will improve for better understanding.
i have to work it out.

Thanks for your update and support


last 2 values : 1st value/2nd value = 95-105% = same, >105% = increase, <95% = decrease
status trend : an UDF (with VBA)
Map2
ABCDEFGHIJKLMNOPQRS
1My questionsSolution I needed
2202120212021202120212021202120212021202120222022StatusLast 2 value status0,00%increase
3MaterialMarAprMayJunJulAugSepOctNovDecJanFebtrendjoined95,00%same
43500026011023,2120001292014875,516831Increasingincrease11023,2;12000;12920;14875,5;16831105,00%decrease
51500020023456789101212Increasingsame2;3;4;5;6;7;8;9;10;12;12
650001294900872872872870Decreasesame900;872;872;872;870
710001108577,5577,5577,5637,5Increasingincrease577,5;577,5;577,5;637,5
850001293510618513560518up&downdecrease510;618;513;560;518
9 
Blad3
Cell Formulas
RangeFormula
O4:O8O4=VLOOKUP(OFFSET($A4,,LARGE(COLUMN($B4:$M4)*(B4:M4<>""),2)-1,,)/OFFSET($A4,,LARGE(COLUMN($B4:$M4)*(B4:M4<>""),1)-1,,),$R$2:$S$4,2,1)
P4:P9P4=TEXTJOIN(";",1,B4:M4)
 
Upvote 0
i can give you a chart (still to be finetuned) where you can select a certain material in E18.
As you can see, it's difficult to translate a curve into terms like "increase, decrease, stable, up-down, ..."

Price Analysis
 
Upvote 0
im new earner in vba

i have opened one excel file (part1.xlsx) and copy the active cell content. (Vendorcode: 200050)

i want to filter the records in another file in part2.xlsx pertains to that vendor code 200050 (3rd column).

if part2.xlsx file is already opened in readonly, the msgbox1 is appear.

if i press yes copied value is not coming

if i press no the prog error is shown as msgbox2

Guide me how to proceed the next step of prog if file is already open
 

Attachments

  • msgbox1.png
    msgbox1.png
    6.9 KB · Views: 1
  • msgbox2.png
    msgbox2.png
    6.2 KB · Views: 2
Upvote 0
This is a completely different question so please start a new thread for it
 
Upvote 0
Status
Not open for further replies.

Forum statistics

Threads
1,215,129
Messages
6,123,217
Members
449,091
Latest member
jeremy_bp001

We've detected that you are using an adblocker.

We have a great community of people providing Excel help here, but the hosting costs are enormous. You can help keep this site running by allowing ads on MrExcel.com.
Allow Ads at MrExcel

Which adblocker are you using?

Disable AdBlock

Follow these easy steps to disable AdBlock

1)Click on the icon in the browser’s toolbar.
2)Click on the icon in the browser’s toolbar.
2)Click on the "Pause on this site" option.
Go back

Disable AdBlock Plus

Follow these easy steps to disable AdBlock Plus

1)Click on the icon in the browser’s toolbar.
2)Click on the toggle to disable it for "mrexcel.com".
Go back

Disable uBlock Origin

Follow these easy steps to disable uBlock Origin

1)Click on the icon in the browser’s toolbar.
2)Click on the "Power" button.
3)Click on the "Refresh" button.
Go back

Disable uBlock

Follow these easy steps to disable uBlock

1)Click on the icon in the browser’s toolbar.
2)Click on the "Power" button.
3)Click on the "Refresh" button.
Go back
Back
Top