Struggling to create % of Fails in pivot tables

phillipscrfc

New Member
Joined
Jul 15, 2023
Messages
1
Office Version
  1. 365
Platform
  1. Windows
Hi All

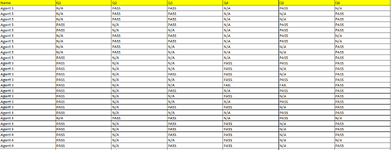
I have some raw data that I receive daily that from a QA perspective has 31 potential questions that we evaluate our staff on. These are either N/A, Pass or Fail depending on the case type.

I can pull the over number of fails etc but through pivot table i cannot generate the %fail of each question for each agent in a table.

Any help would be appreciated.
 

Attachments

  • Data.PNG
    Data.PNG
    31.4 KB · Views: 9

Excel Facts

What does custom number format of ;;; mean?
Three semi-colons will hide the value in the cell. Although most people use white font instead.
Your data is better suited to having a formula in a column to the right of the data that calculates the percentage you want.
 
Upvote 0

Forum statistics

Threads
1,215,219
Messages
6,123,687
Members
449,117
Latest member
Aaagu

We've detected that you are using an adblocker.

We have a great community of people providing Excel help here, but the hosting costs are enormous. You can help keep this site running by allowing ads on MrExcel.com.
Allow Ads at MrExcel

Which adblocker are you using?

Disable AdBlock

Follow these easy steps to disable AdBlock

1)Click on the icon in the browser’s toolbar.
2)Click on the icon in the browser’s toolbar.
2)Click on the "Pause on this site" option.
Go back

Disable AdBlock Plus

Follow these easy steps to disable AdBlock Plus

1)Click on the icon in the browser’s toolbar.
2)Click on the toggle to disable it for "mrexcel.com".
Go back

Disable uBlock Origin

Follow these easy steps to disable uBlock Origin

1)Click on the icon in the browser’s toolbar.
2)Click on the "Power" button.
3)Click on the "Refresh" button.
Go back

Disable uBlock

Follow these easy steps to disable uBlock

1)Click on the icon in the browser’s toolbar.
2)Click on the "Power" button.
3)Click on the "Refresh" button.
Go back
Back
Top