Sumifs or Index match for data summary

AHS5050

New Member
Joined
Feb 6, 2022
Messages
6
Office Version
  1. 2016
Platform
  1. Windows
Hello,

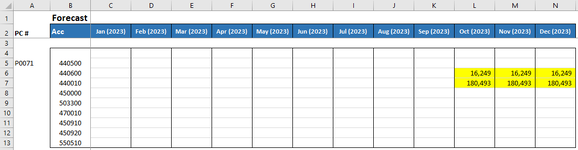
I want to get summary data (first table) for some GLs from a large database (2nd table) based on three criteria, PC# (col A), Acc (Col B) and Month (row # 2). I tried Sumifs and index match but couldn't make it work. I manually populated columns A and B in the 2nd table to use for Sumifs or Index match but still couldn't make it work.

Would you please help?

Thank you very much.

Forecast
PC #AccJan (2023)Feb (2023)Mar (2023)Apr (2023)May (2023)Jun (2023)Jul (2023)Aug (2023)Sep (2023)Oct (2023)Nov (2023)Dec (2023)
P0071440500
44060016,24916,24916,249
440010180,493180,493180,493
450000
503300
470010


Profit CenterGLDate
Jul (2023)

Aug (2023)

Sep (2023)

Oct (2023)

Nov (2023)

Dec (2023)
Profit CenterAccount
P0071IS ISP0071 Shady Oaks 2▾ IS IS-346,055.11-346,055.11-346,055.11
NET_EA▾ NET_EAR Net Earnings-346,055.11-346,055.11-346,055.11
EAR_BE▾ EAR_BEF_NCI Earnings Before NCI-346,055.11-346,055.11-346,055.11
EBT EB▾ EBT EBT-346,055.11-346,055.11-346,055.11
EBIT E▾ EBIT EBIT-346,055.11-346,055.11-346,055.11
EBITDA▾ EBITDA EBITDA31,208.9331,208.9331,208.93
BG _PR▾ BG _PRO BG Profit31,208.9331,208.9331,208.93
NET_RE▾ NET_REV Net Revenue308,846.35308,846.35308,846.35
REV Re▾ REV Revenue308,846.35308,846.35308,846.35
NON_RE▾ NON_REG_ENE_REV Non Regulated Energy Revenue196,741.46196,741.46196,741.46
CON_EN▾ CON_ENE_REV Contracted Energy Revenue180,492.70180,492.70180,492.70
440010440010 PPA180,492.70180,492.70180,492.70
CAP_RE▾ CAP_REV_CON Capacity Revenue - Contracts0.010.010.01
440500▾ 440500 Contracts - Capacity0.010.010.01
CAP_RE▾ CAP_REV_REA Capacity Revenue - Reactive16,248.7516,248.7516,248.75
440600440600 Reactive - Capacity16,248.7516,248.7516,248.75
OTH_RE▾ OTH_REV Other Revenue112,104.89112,104.89112,104.89
REC_RE▾ REC_REV_CON REC Revenue - Contracts112,104.89112,104.89112,104.89
450000450000 Contracts - REC112,104.89112,104.89112,104.89
OPEX O▾ OPEX OPEX277,637.42277,637.42277,637.42
SIT_OV▾ SIT_OVE Site Overhead277,637.42277,637.42277,637.42
MIS_OT▾ MIS_OTH_DED Miscellaneous Other Deductions277,637.42277,637.42277,637.42
503300503300 Miscellaneous Other Deductions277,637.42277,637.42277,637.42
 

Attachments

  • 1696650954815.png
    1696650954815.png
    26.3 KB · Views: 4

Excel Facts

Create a Pivot Table on a Map
If your data has zip codes, postal codes, or city names, select the data and use Insert, 3D Map. (Found to right of chart icons).
Fill down the PC#s in both tables and your problem becomes a lot easier to solve:
Mr Excel.xlsx
ABCDEFGHIJK
1Forecast
2PC #AccApr (2023)May (2023)Jun (2023)Jul (2023)Aug (2023)Sep (2023)Oct (2023)Nov (2023)Dec (2023)
3
4
5P0071440500------0,010,010,01
6P0071440600------16 248,7516 248,7516 248,75
7P0071440010------180 492,70180 492,70180 492,70
8P0071450000------112 104,89112 104,89112 104,89
9P0071503300------277 637,42277 637,42277 637,42
10P0071470010---------
11
12
13Profit CenterGLDateJul (2023)Aug (2023)Sep (2023)Oct (2023)Nov (2023)Dec (2023)
14Profit CenterAccount
15P0071IS ISP0071 Shady Oaks 2▾ IS IS---- 346 055,11- 346 055,11- 346 055,11
16P0071NET_EA▾ NET_EAR Net Earnings---- 346 055,11- 346 055,11- 346 055,11
17P0071EAR_BE▾ EAR_BEF_NCI Earnings Before NCI---- 346 055,11- 346 055,11- 346 055,11
18P0071EBT EB▾ EBT EBT---- 346 055,11- 346 055,11- 346 055,11
19P0071EBIT E▾ EBIT EBIT---- 346 055,11- 346 055,11- 346 055,11
20P0071EBITDA▾ EBITDA EBITDA---31 208,9331 208,9331 208,93
21P0071BG _PR▾ BG _PRO BG Profit---31 208,9331 208,9331 208,93
22P0071NET_RE▾ NET_REV Net Revenue---308 846,35308 846,35308 846,35
23P0071REV Re▾ REV Revenue---308 846,35308 846,35308 846,35
24P0071NON_RE▾ NON_REG_ENE_REV Non Regulated Energy Revenue---196 741,46196 741,46196 741,46
25P0071CON_EN▾ CON_ENE_REV Contracted Energy Revenue---180 492,70180 492,70180 492,70
26P0071440010440010 PPA---180 492,70180 492,70180 492,70
27P0071CAP_RE▾ CAP_REV_CON Capacity Revenue - Contracts---0,010,010,01
28P0071440500▾ 440500 Contracts - Capacity---0,010,010,01
29P0071CAP_RE▾ CAP_REV_REA Capacity Revenue - Reactive---16 248,7516 248,7516 248,75
30P0071440600440600 Reactive - Capacity---16 248,7516 248,7516 248,75
31P0071OTH_RE▾ OTH_REV Other Revenue---112 104,89112 104,89112 104,89
32P0071REC_RE▾ REC_REV_CON REC Revenue - Contracts---112 104,89112 104,89112 104,89
33P0071450000450000 Contracts - REC---112 104,89112 104,89112 104,89
34P0071OPEX O▾ OPEX OPEX---277 637,42277 637,42277 637,42
35P0071SIT_OV▾ SIT_OVE Site Overhead---277 637,42277 637,42277 637,42
36P0071MIS_OT▾ MIS_OTH_DED Miscellaneous Other Deductions---277 637,42277 637,42277 637,42
37P0071503300503300 Miscellaneous Other Deductions---277 637,42277 637,42277 637,42
Sheet3
Cell Formulas
RangeFormula
C5:J10C5=IFNA(INDEX($F$15:$K$37,MATCH($A5&$B5,$A$15:$A$37&$B$15:$B$37,0),MATCH(C$2,$F$13:$K$13,0)),0)
K5:K10K5=SUMIFS(INDEX($F$15:$K$37,,MATCH(K$2,$F$13:$K$13,0)),$A$15:$A$37,$A5,$B$15:$B$37,$B5)
A6:A10,A16:A37A6=A5

I'd prefer using the index / match all the way but since you had tried the sumifs as well I decided to use that in the Dec column just to show that sometimes the sumifs is not the easiest way to solve things.
However, if you want to find out the best way to solve your problem try using Power Query to unpivot your date columns of your lookup table ( select the "constant" columns and use the unpivot other columns to make sure the query adapts to new columns in your data source ). That way your date columns become a similar single column and all your values can be found in a single column as well. That is the "correct" way to store data to be used in calculations. That way your sumifs would become a lot easier - or better yet create a simple pivot table and you don't even need the formulas anymore:
Profit CenterGLDate Value Sum of ValueDate
P0071IS ISOct (2023)- 346 055,11Profit CenterGLDec (2023)Nov (2023)Oct (2023)Grand Total
P0071IS ISNov (2023)- 346 055,11P0071440010180492,7180492,7180492,7541478,1
P0071IS ISDec (2023)- 346 055,114405000,010,010,010,03
P0071NET_EAOct (2023)- 346 055,1144060016248,7516248,7516248,7548746,25
P0071NET_EANov (2023)- 346 055,11450000112104,89112104,89112104,89336314,67
P0071NET_EADec (2023)- 346 055,11503300277637,42277637,42277637,42832912,26
P0071EAR_BEOct (2023)- 346 055,11P0071 Total586483,77586483,77586483,771759451,31
P0071EAR_BENov (2023)- 346 055,11Grand Total586483,77586483,77586483,771759451,31

The best thing about the Power Query solution is you could keep your source data in other file(s) and whenever you get new data / new files / new products etc. all you need to do is click the Refresh All button and your pivot table would be up to date.
 
Upvote 0
Thank you Misca for your help. Appreciate it. It worked.
 
Upvote 0

Forum statistics

Threads
1,215,108
Messages
6,123,128
Members
449,097
Latest member
mlckr

We've detected that you are using an adblocker.

We have a great community of people providing Excel help here, but the hosting costs are enormous. You can help keep this site running by allowing ads on MrExcel.com.
Allow Ads at MrExcel

Which adblocker are you using?

Disable AdBlock

Follow these easy steps to disable AdBlock

1)Click on the icon in the browser’s toolbar.
2)Click on the icon in the browser’s toolbar.
2)Click on the "Pause on this site" option.
Go back

Disable AdBlock Plus

Follow these easy steps to disable AdBlock Plus

1)Click on the icon in the browser’s toolbar.
2)Click on the toggle to disable it for "mrexcel.com".
Go back

Disable uBlock Origin

Follow these easy steps to disable uBlock Origin

1)Click on the icon in the browser’s toolbar.
2)Click on the "Power" button.
3)Click on the "Refresh" button.
Go back

Disable uBlock

Follow these easy steps to disable uBlock

1)Click on the icon in the browser’s toolbar.
2)Click on the "Power" button.
3)Click on the "Refresh" button.
Go back
Back
Top