Update chart series to today

Bandito1

Board Regular
Joined
Oct 18, 2018
Messages
237
Office Version
  1. 2016
Platform
  1. Windows
Hi all,

I have this chart that shows how many files are on my desk.
I use formulas to keep it up to date;

In column D it shows the amount of files currently on my desk.

Now my chart series need to get updated every day.
Today it's 7 february. This should be the end of the series of my chart
Tomorrow it's the 8 and then the chart should include that one two.

I saw some soluations but that doesn't work for me. The data is with formules and as you can see the formule is already presents for 8 february and so on.

Someone got some idea how the series of the chart can go to today and adjusts every day?

Tracker QA on the floor New.xlsm
ABCD
2MonthInOutDesk
Sheet1

Tracker QA on the floor New.xlsm
ABCD
12801-Feb-237358
12902-Feb-233655
13003-Feb-231551
13104-Feb-230348
13205-Feb-230246
13306-Feb-234446
13407-Feb-236448
13508-Feb-230048
13609-Feb-230048
13710-Feb-230048
Sheet1
Cell Formulas
RangeFormula
B128:B137B128=IF(A128="","",SUMPRODUCT(--('Tracker QA on the Floor'!$J:$J=A128)))
C128:C137C128=IF(A128="","",SUMPRODUCT(--('Tracker QA on the Floor'!$L:$L=A128)))
D128:D137D128=D127+B128-C128
 

Excel Facts

Which came first: VisiCalc or Lotus 1-2-3?
Dan Bricklin and Bob Frankston debuted VisiCalc in 1979 as a Visible Calculator. Lotus 1-2-3 debuted in the early 1980's, from Mitch Kapor.
Thank you for your reply
Found that solution but in afraid that doesnt work

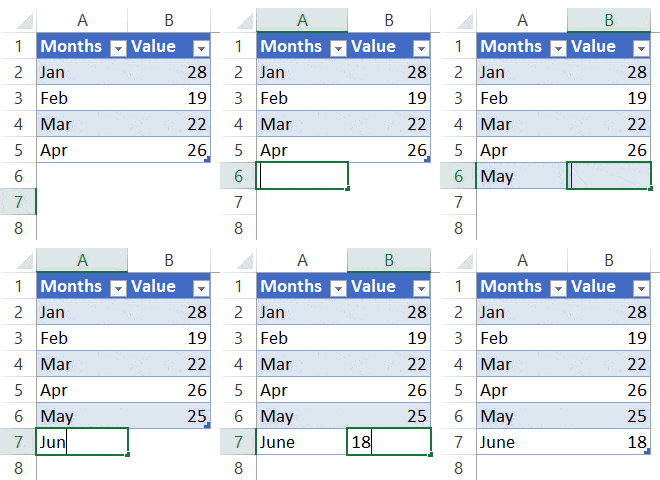
I dont want to manual add each new day to the table

As you can see I pulled down the dates to (not in this example) to 2024

I dont want to update the data manual. There is a formula in it that calculates the file in my desk for each day till like 2024

But when i make table from it the table shows more data then today and the end of chart is 48, 48, 48, 48 while it should stop by 46 cause that is today (was)
 
Upvote 0
how many days do you want to see in your series range from today?
What kind of chart are you making? Which Series do you want on the chart?

Also, why do you have column name of Month, when the dates seem to be a sequence of days?
 
Upvote 0
Here is one way. It uses the Today() function and VLOOKUPS. If your data gets very large the workbook will process slowly.

Mr Excel Questions 3.xlsm
ABCDEFGHI
1MonthInOutDeskMonthInOutDesk
201-Feb-202373002/09/2023000
302-Feb-202336002/08/2023000
403-Feb-202315002/07/2023640
504-Feb-202303002/06/2023440
605-Feb-202302002/05/2023020
706-Feb-202344002/04/2023030
807-Feb-202364002/03/2023150
908-Feb-2023000
1009-Feb-2023000
Sheet1
Cell Formulas
RangeFormula
F2F2=TODAY()
G2:I8G2=VLOOKUP($F2,$A$2:$D$543,COLUMNS($F$1:G$1),0)
F3:F8F3=F2-1
D2:D10D2=D127+B128-C128


sample chart:
1675934450859.png
 
Upvote 0
Here is one way. It uses the Today() function and VLOOKUPS. If your data gets very large the workbook will process slowly.

Mr Excel Questions 3.xlsm
ABCDEFGHI
1MonthInOutDeskMonthInOutDesk
201-Feb-202373002/09/2023000
302-Feb-202336002/08/2023000
403-Feb-202315002/07/2023640
504-Feb-202303002/06/2023440
605-Feb-202302002/05/2023020
706-Feb-202344002/04/2023030
807-Feb-202364002/03/2023150
908-Feb-2023000
1009-Feb-2023000
Sheet1
Cell Formulas
RangeFormula
F2F2=TODAY()
G2:I8G2=VLOOKUP($F2,$A$2:$D$543,COLUMNS($F$1:G$1),0)
F3:F8F3=F2-1
D2:D10D2=D127+B128-C128


sample chart:
View attachment 84973
Ijust realized the formula in column C did not come through. Will repost...
 
Upvote 0
Cell D2 references E1, which enforced the starting number from your worksheet ranges
Mr Excel Questions 3.xlsm
ABCDEFGHI
1MonthInOutDesk54MonthInOutDesk
201-Feb-2023735802/09/20230048
302-Feb-2023365502/08/20230048
403-Feb-2023155102/07/20236448
504-Feb-2023034802/06/20234446
605-Feb-2023024602/05/20230246
706-Feb-2023444602/04/20230348
807-Feb-2023644802/03/20231551
908-Feb-20230048
1009-Feb-20230048
Dynamic Series Base on TODAY()
Cell Formulas
RangeFormula
F2F2=TODAY()
G2:I8G2=VLOOKUP($F2,$A$2:$D$543,COLUMNS($F$1:G$1),0)
F3:F8F3=F2-1
D2D2=E1+B2-C2
D3:D10D3=N(D2)+B3-C3


1675936403972.png
 
Upvote 1
Solution
Happy to help.
I also suggest you put the "Desk" line on the secondary axis. This will make the other two line stand out better, and not be so flat. If you don't know how to do that, please post again.

If you think a post has provided you with the solution please mark it as an answer.
 
Upvote 0

Forum statistics

Threads
1,215,695
Messages
6,126,265
Members
449,308
Latest member
VerifiedBleachersAttendee

We've detected that you are using an adblocker.

We have a great community of people providing Excel help here, but the hosting costs are enormous. You can help keep this site running by allowing ads on MrExcel.com.
Allow Ads at MrExcel

Which adblocker are you using?

Disable AdBlock

Follow these easy steps to disable AdBlock

1)Click on the icon in the browser’s toolbar.
2)Click on the icon in the browser’s toolbar.
2)Click on the "Pause on this site" option.
Go back

Disable AdBlock Plus

Follow these easy steps to disable AdBlock Plus

1)Click on the icon in the browser’s toolbar.
2)Click on the toggle to disable it for "mrexcel.com".
Go back

Disable uBlock Origin

Follow these easy steps to disable uBlock Origin

1)Click on the icon in the browser’s toolbar.
2)Click on the "Power" button.
3)Click on the "Refresh" button.
Go back

Disable uBlock

Follow these easy steps to disable uBlock

1)Click on the icon in the browser’s toolbar.
2)Click on the "Power" button.
3)Click on the "Refresh" button.
Go back
Back
Top