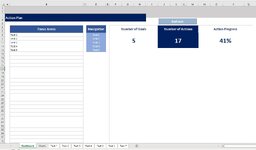
Im making this Action Planer I saw a few screenshots when googling ideas and decided to make this one and it has been the vain of my life the past 48 hours, I tried AI to assist me and It has made it worse.
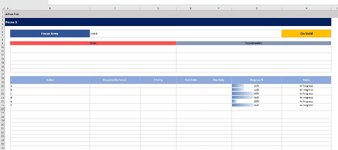
The code works for creating new sheets etc, but when it comes to generating Graphs it does not work and is driving me crazy, it should look for any sheets named the same as the Dashboard B8 to B36 cells and calculate based on that as when someone adds or deletes a sheet I want it to add or remove data from that chart. I tried to get it to generate charts to the Charts tab and was then going to link them to the dashboard so it fits and is neat.
Please help
Private Sub CommandButton1_Click()
RefreshCharts
CalculateTotalsAndPercentages
End Sub
Private Sub Worksheet_Change(ByVal Target As Range)
Dim KeyRange As Range
Set KeyRange = Me.Range("B8:B36")
If Not Intersect(Target, KeyRange) Is Nothing Then
Application.EnableEvents = False
On Error GoTo CleanUp
Dim cell As Range
For Each cell In Intersect(Target, KeyRange)
If cell.value <> "" And Not WorksheetExists(cell.value) Then
Dim newSheet As Worksheet
Set newSheet = ThisWorkbook.Sheets.Add(After:=ThisWorkbook.Sheets(ThisWorkbook.Sheets.Count))
ThisWorkbook.Sheets("Template").Cells.Copy newSheet.Cells
newSheet.Name = cell.value
With cell.Offset(0, 2)
.Hyperlinks.Add Anchor:=.Cells, Address:="", SubAddress:="'" & newSheet.Name & "'!A1", TextToDisplay:=newSheet.Name
.Font.Color = RGB(255, 255, 255)
.Font.Bold = True
.Font.Underline = xlUnderlineStyleNone
End With
newSheet.Range("C6").value = cell.value
newSheet.Tab.Color = RGB(255, 255, 255)
Debug.Print "New sheet created and linked for " & cell.value
End If
Next cell
CleanUp:
Application.EnableEvents = True
RefreshCharts
Debug.Print "Events re-enabled"
If Err.Number <> 0 Then MsgBox "Error " & Err.Number & ": " & Err.Description, vbCritical
End If
End Sub
Sub RefreshCharts()
CreateBarGraph
CreatePercentageGraph
CreateWordCountGraph
CreatePieChart
End Sub
Sub CalculateTotalsAndPercentages()
Dim cell As Range
Dim sheet As Worksheet
Dim percentageSum As Double
Dim percentageCount As Long
Dim totalPopulatedCells As Long
For Each cell In Me.Range("B8:B36")
Dim sheetName As String
sheetName = cell.value
If sheetName <> "" And sheetName <> "Dashboard" And sheetName <> "Template" Then
Set sheet = Nothing
On Error Resume Next
Set sheet = ThisWorkbook.Sheets(sheetName)
On Error GoTo 0
If Not sheet Is Nothing Then
For i = 20 To 39
If sheet.Range("G" & i).value <> "" Then
Dim cellValue As String
cellValue = Replace(sheet.Range("G" & i).value, "%", "")
If IsNumeric(cellValue) Then
percentageSum = percentageSum + val(cellValue)
percentageCount = percentageCount + 1
End If
End If
If sheet.Range("B" & i).value <> "" Then
totalPopulatedCells = totalPopulatedCells + 1
End If
Next i
End If
End If
Next cell
Dim overallPercentage As Double
If percentageCount > 0 Then
overallPercentage = percentageSum / percentageCount
Me.Range("N8").value = Format(overallPercentage, "0.00%")
Else
Me.Range("N8").value = "0%"
End If
Me.Range("J8").value = totalPopulatedCells
Debug.Print "Updated J8 and N8: Total Cells=" & totalPopulatedCells & "; Percentage=" & Format(overallPercentage, "0.00%")
End Sub
Function WorksheetExists(shtName As String, Optional wb As Workbook) As Boolean
Dim sht As Worksheet
If wb Is Nothing Then Set wb = ThisWorkbook
On Error Resume Next
Set sht = wb.Sheets(shtName)
On Error GoTo 0
WorksheetExists = Not sht Is Nothing
End Function
Sub CreateBarGraph()
Dim ws As Worksheet
Dim chartWs As Worksheet
Dim chartObj As ChartObject
Dim dataRange As Range
Dim wordCounts As Object
Dim cell As Range
Dim sheetName As Range
Dim r As Long
Set wordCounts = CreateObject("Scripting.Dictionary")
Set chartWs = ThisWorkbook.Sheets("Charts")
chartWs.Cells.Clear
chartWs.ChartObjects.Delete
' Loop through each sheet name in Dashboard B8:B36
For Each sheetName In ThisWorkbook.Worksheets("Dashboard").Range("B8:B36")
If sheetName.value <> "" And WorksheetExists(sheetName.value) Then
Set ws = ThisWorkbook.Sheets(sheetName.value)
' Adjusted to the correct range H20:H29
For Each cell In ws.Range("H20:H29")
' Check if the cell is not blank
If Not IsEmpty(cell) Then
' Check if the cell value is one of the specified statuses
Debug.Print "Cell Value: " & cell.value
If cell.value = "In Progress" Or cell.value = "Complete" Or cell.value = "Not Started" Then
Debug.Print "Valid Status Found: " & cell.value
If Not wordCounts.Exists(cell.value) Then
wordCounts.Add cell.value, 1
Else
wordCounts(cell.value) = wordCounts(cell.value) + 1
End If
End If
End If
Next cell
End If
Next sheetName
' Transfer data to the Charts sheet
r = 1
For Each word In wordCounts.Keys
chartWs.Cells(r, 1).value = word
chartWs.Cells(r, 2).value = wordCounts(word)
r = r + 1
Next word
' Debugging: Print the data transferred to the Charts sheet
Debug.Print "Data Transferred to Charts Sheet:"
For Each cell In chartWs.Range("A1:B" & r - 1)
Debug.Print cell.Address & ": " & cell.value
Next cell
If r > 1 Then
Set dataRange = chartWs.Range(chartWs.Cells(1, 1), chartWs.Cells(r - 1, 2))
Set chartObj = chartWs.ChartObjects.Add(Left:=10, Top:=10, Width:=600, Height:=400)
chartObj.BringToFront
With chartObj.chart
.SetSourceData Source:=dataRange
.ChartType = xlColumnClustered
.HasTitle = True
.ChartTitle.Text = "Project Status Summary"
End With
Debug.Print "Chart created successfully"
Else
Debug.Print "No data to create chart."
End If
End Sub
Sub CreatePercentageGraph()
Dim ws As Worksheet
Dim chartWs As Worksheet
Dim chartObj As ChartObject
Dim dataRange As Range
Dim cell As Range
Dim sheetName As Range
Dim r As Long
Dim c100 As Long, cLess50 As Long, cMore50 As Long
Set chartWs = ThisWorkbook.Sheets("Charts")
chartWs.Cells.Clear
chartWs.ChartObjects.Delete
' Initialize counters
c100 = 0: cLess50 = 0: cMore50 = 0
' Loop through all the sheets specified in Dashboard
For Each sheetName In ThisWorkbook.Worksheets("Dashboard").Range("B8:B36")
If sheetName.value <> "" And WorksheetExists(sheetName.value) Then
Set ws = ThisWorkbook.Sheets(sheetName.value)
For Each cell In ws.Range("G20:G39")
If IsNumeric(cell.value) Then
If cell.value = 1 Then
c100 = c100 + 1
ElseIf cell.value < 0.5 Then
cLess50 = cLess50 + 1
ElseIf cell.value > 0.5 Then
cMore50 = cMore50 + 1
End If
End If
Next cell
End If
Next sheetName
' Creating chart data
r = 1
With chartWs
.Cells(r, 1).value = "100%": .Cells(r, 2).value = c100: r = r + 1
.Cells(r, 1).value = "<50%": .Cells(r, 2).value = cLess50: r = r + 1
.Cells(r, 1).value = ">50%": .Cells(r, 2).value = cMore50
End With
' Define data range and create chart
Set dataRange = chartWs.Range(chartWs.Cells(1, 1), chartWs.Cells(3, 2))
Set chartObj = chartWs.ChartObjects.Add(Left:=450, Top:=50, Width:=375, Height:=225)
With chartObj.chart
.SetSourceData Source:=dataRange
.ChartType = xlColumnClustered
.HasTitle = True
.ChartTitle.Text = "Percentage Overview"
End With
End Sub
Sub CreateWordCountGraph()
Dim ws As Worksheet
Dim chartWs As Worksheet
Dim chartObj As ChartObject
Dim cell As Range
Dim sheetName As Range
Dim r As Long
Dim wordCounts As Object
Dim wordsToCount As Variant
Dim word As Variant
Set wordCounts = CreateObject("Scripting.Dictionary")
Set chartWs = ThisWorkbook.Sheets("Charts")
chartWs.Cells.Clear
chartWs.ChartObjects.Delete
' Define the words to count
wordsToCount = Array("Achieved", "In Progress", "On Hold", "Cancelled")
' Loop through each sheet in B20:B36
For Each sheetName In ThisWorkbook.Worksheets("Dashboard").Range("B8:B36")
If sheetName.value <> "" And WorksheetExists(sheetName.value) Then
Set ws = ThisWorkbook.Sheets(sheetName.value)
If Not IsError(ws.Range("H6").value) Then
Dim currentValue As String
currentValue = ws.Range("H6").value
If wordCounts.Exists(currentValue) Then
wordCounts(currentValue) = wordCounts(currentValue) + 1
Else
wordCounts(currentValue) = 1 ' Initialize count for new word
End If
End If
End If
Next sheetName
' Populate the worksheet with data
r = 1
For Each word In wordsToCount
If wordCounts.Exists(word) Then
chartWs.Cells(r, 1).value = word
chartWs.Cells(r, 2).value = wordCounts(word)
r = r + 1
End If
Next word
' Define data range and create chart
Dim dataRange As Range
Set dataRange = chartWs.Range("A1:B" & r - 1)
Set chartObj = chartWs.ChartObjects.Add(Left:=100, Top:=50, Width:=375, Height:=225)
With chartObj.chart
.SetSourceData Source:=dataRange
.ChartType = xlColumnClustered
.HasTitle = True
.ChartTitle.Text = "Keyword Frequency in H6"
End With
End Sub
Sub CreatePieChart()
Dim ws As Worksheet
Dim chartWs As Worksheet
Dim chartObj As ChartObject
Dim cell As Range
Dim sheetName As Range
Dim total As Long, achievedCount As Long
Dim dataRange As Range
Set chartWs = ThisWorkbook.Sheets("Charts")
chartWs.Cells.Clear
chartWs.ChartObjects.Delete
total = 0: achievedCount = 0
' Loop through all the sheets specified in Dashboard
For Each sheetName In ThisWorkbook.Worksheets("Dashboard").Range("B8:B36")
If sheetName.value <> "" And WorksheetExists(sheetName.value) Then
Set ws = ThisWorkbook.Sheets(sheetName.value)
For Each cell In ws.Range("H20:H39")
If cell.value = "Achieved" Then
achievedCount = achievedCount + 1
End If
total = total + 1
Next cell
End If
Next sheetName
' Setup data for pie chart
chartWs.Cells(1, 1).value = "Achieved"
chartWs.Cells(1, 2).value = achievedCount
chartWs.Cells(2, 1).value = "Other"
chartWs.Cells(2, 2).value = total - achievedCount
' Define data range for the chart
Set dataRange = chartWs.Range(chartWs.Cells(1, 1), chartWs.Cells(2, 2))
Set chartObj = chartWs.ChartObjects.Add(Left:=450, Top:=300, Width:=375, Height:=225)
With chartObj.chart
.SetSourceData Source:=dataRange
.ChartType = xlPie
.HasTitle = True
.ChartTitle.Text = "Achieved Overview"
End With
End Sub
Attachments
Last edited:


