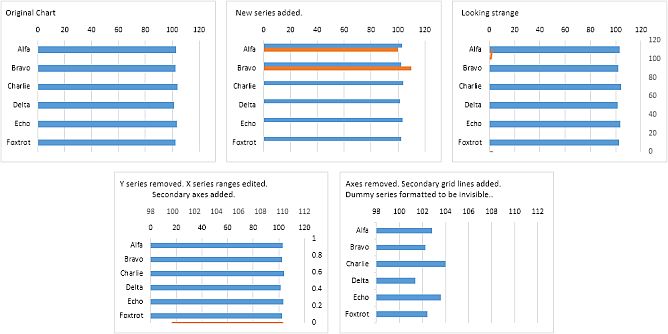
I have number of charts on Sheet1 of a workbook that are dynamic. However, the min and max y-values tend to fluctuate greatly when I adjust the parameters. The "Auto" option on the axis options page doesn't work very well, as it always sets the minimum of my bar charts to "0". This renders the charts useless if, for example, the data is between 100-105.
I was wondering if there was a way to make each chart automatically adjust the y-axis range to [(min - 10), (max + 10)]? In the example above, the min/max bounds of the y-axis would auto adjust to (90, 115).
Thanks!
I was wondering if there was a way to make each chart automatically adjust the y-axis range to [(min - 10), (max + 10)]? In the example above, the min/max bounds of the y-axis would auto adjust to (90, 115).
Thanks!
Last edited: