Excel Blood Pressure & Heart Rate AVG?

puw

New Member
Joined
Nov 2, 2022
Messages
6
Office Version
  1. 2016
  2. 2010
  3. 2007
Platform
  1. Windows
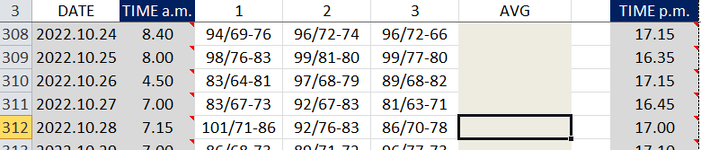
Twice a day I take my BP & heart rate. Each time I take 3 tests and then manually AVG.

The format I use in each column for the digital testing machine's results is S/D-H (85/70-81).

Because this is a standard way of showing these 3 measurements and because with a total of 6 measurements a day ... plus additional data, I want to keep to this format so that I can easily input and see ALL data I input on a screen without left/right scrolling (not spread out over multiple columns for individual numbers taking up too much width with all the additional data - which I know now would make it so much easier to do, but I do not have time now to reset all the data).

I came across this thread BP Excel Formula and have tried to change what I think should be changed but since I have a 'LEFT', a 'MIDDLE' and a 'RIGHT' number along with the '/' & '-' x 3 for each test, I cannot work out how to alter it to work. Unfortunately I am not very good when it comes to working out a formula for such data.

The data collected up to now covers almost 12 months - so there is a lot.

Occasionally I am too busy and 'miss' a test.

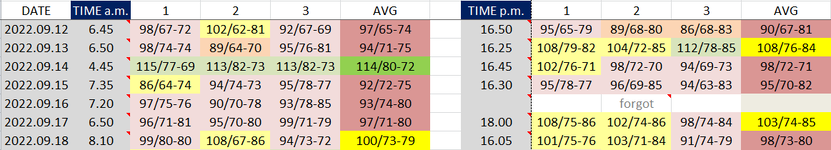
I have a colour code range that reflects the SYSTOLIC result only (that's the high number of the two ref. BP) ... but I am not sure this is available via using a formula because each result is a lighter shade of a main colour, the main colour being the one used for the average.

Can anyone please help me know if Excel can handle a formula for the way I input the data to create an AVG automatically. Can anyone help me to create the formula please? If it is possible, then I would like to link the AVG results to a 2nd sheet to show a chart. Due to where I live and COVID, it has not been possible for me to get back to see the doctor since the beginning of the year and I collect this data so as when I can get to see them, they will have an easy identifiable way of seeing how my health has been doing over this last year via the medication they initially set me on and whether they prefer the numbers or a chart, they can hopefully deduce future treatment more easily from my daily records. For my benefit, it would make my task of record keeping much easier & time efficient (because it takes quite a bit of time to input ALL of the data I collect and record, AVG the results, colour code as per images below etc).

Many thanks and I've included some screen shots that I hope will help you understand.
 

Attachments

  • range 1.png
    range 1.png
    15.4 KB · Views: 36
  • range 2.png
    range 2.png
    33.4 KB · Views: 36
  • colour key.png
    colour key.png
    3.7 KB · Views: 35

Excel Facts

Copy formula down without changing references
If you have =SUM(F2:F49) in F50; type Alt+' in F51 to copy =SUM(F2:F49) to F51, leaving the formula in edit mode. Change SUM to COUNT.
You can use the formulas below to show the averages in 3 columns.
The averages in columns E:G can be used to calculate averages by month etc.
You can change the rounding or ignore that version; it is your choice.


T202211a.xlsm
ABCDEFG
1#1#2#3Averages
294/69-7696-72-7496/72-6695.333337172
394/69-7696-72-7496/72-6695.371.072.0
4
2a
Cell Formulas
RangeFormula
E2E2=AVERAGE(--MID(B2:D2,1,2))
F2F2=AVERAGE(--MID(B2:D2,4,2))
G2G2=AVERAGE(--MID(B2:D2,7,2))
E3E3=ROUND(AVERAGE(--MID(B3:D3,1,2)),1)
F3F3=ROUND(AVERAGE(--MID(B3:D3,4,2)),1)
G3G3=ROUND(AVERAGE(--MID(B3:D3,7,2)),1)
 
Last edited:
Upvote 0
A different approach that you can consider going forward is as follows

DGP_Health_2022.xlsm
ABCDE
56Sep 21, 2022126715655
BP_am
Cell Formulas
RangeFormula
B56B56=(122+132+124)/3
C56C56=(71+71+72)/3
D56D56=(57+56+56)/3
E56E56=ROUND([@Systolic]-[@Diastolic],0)
 
Upvote 0
Thank you for the quick response and formulas offered.

Am I right in thinking that I cannot use the 3 test results as I input to create an AVG for the S/D-HR in a single cell? Do I have to split the 3 test results and get an AVG result for the Systolic in one cell, an AVG result for the Diastolic in one cell & an AVG result for the heart result in one cell? Then somehow put these 3 cell AVG results back into a single cell as per my preferred format?

In otherwords, use another sheet to draw the data from my 1st sheet, make the calculations so as to input back into a single cell on the 1st sheet (as I've shown labelled AVG)
 
Upvote 0
1. I recommend keeping the process as simple as possible and as easy as possible for you to use.

2. "Am I right in thinking that I cannot use the 3 test results as I input to create an AVG for the S/D-HR in a single cell? "
If you mean an average of the Diastolic, Systolic, and Pulse as one number, yes that could be done but I do not believe that would yield any useful information. The statistics on each of Diastolic etc. can yield relevant information.
N.B. When the results are combined like in 94/82-62, the information is Text and you cannot easily complete calculations or summaries.

3."In otherwords, use another sheet to draw the data from my 1st sheet, make the calculations so as to input back into a single cell on the 1st sheet (as I've shown labelled AVG)"
This would be possible but probably unnecessary.
There are 16,384 columns available.
The data can be entered in cells, calculated, and recapped.
The Data entry columns can be hidden/unhidden with a click on a button
4. If the data is summarized as numbers, conditional formatting may automatically color the cells.

5. It may be logical to use the ability of Excel to summarize etc.

T202211a.xlsm
ABCDEFGHIJKLM
4Averages
5Diastolic 1Diastolic 2Diastolic 3Systolic 1Systolic 2Systolic 3Pulse 1Pulse 2Pulse 3Diastolic SystolicPulse
62-Nov-2294969669727276746695.371.072.0
2a
Cell Formulas
RangeFormula
K6K6=AVERAGE(B6:D6)
L6L6=AVERAGE(E6:G6)
M6M6=AVERAGE(H6:J6)
 
Upvote 0
Thank you, I think I understand. You've been very helpful.
 
Upvote 0
Thanks for the feedback.

If you need additional assistance, please let us know.

" whether they prefer the numbers or a chart, they can hopefully deduce future treatment more easily from my daily records"

You could ask your Doctor or Nurse what data would be helpful.
 
Upvote 0
Columns B:J are hidden
K L and M show the averages
Column N combines the averages (not recommended)

T202211a.xlsm
AKLMN
1
2
3
4Averages
5Diastolic SystolicPulse
62-Nov-2295.371.072.095/71-72
7
2a
Cell Formulas
RangeFormula
K6K6=AVERAGE(B6:D6)
L6L6=AVERAGE(E6:G6)
M6M6=AVERAGE(H6:J6)
N6N6=TEXT(K6,"##")&"/"&TEXT(L6,"##")&"-"&TEXT(M6,"##")
 
Upvote 0
David, thank you for continuing to work on this problem. Please do not take any of the following in offence because none is meant.

Where I live is like nowhere else and to avoid wrongful presumptions I prefer to not give that information - strange as that might sound. Therefore the sheets need to work a certain way which may not fit within other people's perception.

With any data, it must make sense to whoever the data is for and in this instance that is a) myself & b) a doctor. The format which the doctor is used to is totally governed by a) their training & b) their hospital's standardised output (which unfortunately changes in different parts of the world despite the perception that it is standardised), such as when a patient is hooked up to a digital 24 hour constant monitoring/testing machine - I have such results and so am following that structure as best I can. Add into this mix through using today's technology and the resulting data must be clearly and easily visible via large smartphone & say 10" tablet screens. This in turn creates a limitation on the output easily visible if there are too many columns spread over the width of a sheet for individual numbers, which can make you want to reduce the number of columns (hide) and yet all the data is relevant, such as the range of results over three tests in the morning and the three late afternoon / early evening ones when any single AVG result requires digging down to see the reason for a sudden spike and if the spike was a 'one off' of the 3 tests or a complete set over each group of 3 tests. In other words looking for a pattern to explain any sudden variations.

We then have the data analyst person who has to do the number crunching and who may or may not be aware of the way to present the data for the intended recipients in order for them to understand the data and therefore find the data useful, with the analyst being more concerned with just presenting the data in a way they consider is the best way, which may or may not be due to any limitations of the software such as Excel.

When I first began self-testing, the data I input was just the basic home machine's results, but grew quite quickly to include a range of data both numbers and texts in addition to just BP & heart rates (whether text = within a cell or a comment) that overall combines to reflect a total view of daily health (eg - weight/diet/exercise done/ + diary type notes etc) in order to try and find patterns of lifestyle which result in negative aspects so as to change my lifestyle - such as what I ate, when I ate, stressful days, a good night's sleep etc. I've discovered that all these factors are not only relevant but also interconnected. Why am I trying to explain this? Because 'all' data input needs to be visible in this instance and Excel is my tool of choice because of its versatilty. So the task at hand amd what I initially asked for seems easy enough to work out a solution, but with everything else in addition to that data I record, the overall task & Excel sheet data becomes more complex. This is my problem and I have to try to see which of your solutions will work the best, if at all.

So I am looking at starting over which means redesigning the sheet with not 8 colums covering both sets of 3 test results and an AVG but 24 columns. Initially I've got the 'spread' to just a little wider than the original as can be seen attached which I think I can live with. I now need to work out if there is an easy way to extract the original data format of 95/82-89 to individual cells, and then see how and if the shading/colouring of cells gives the same/right instant visual appearance.

I think your later formulas may work best for me. Again, many thanks for continuing to look at this and I will respond with an update in the next few days, as I will work on this as and when I have time available. Hoping the above helps you to understand more :)
 

Attachments

  • range new sheet test.png
    range new sheet test.png
    9 KB · Views: 5
  • range original comparision.png
    range original comparision.png
    6.9 KB · Views: 6
Upvote 0
You have provided good information. It is a challenge providing suggestions when I do not know the data, background, goals, constraints, etc.

You stated "an easy way to extract the original data format of 95/82-89 to individual cells". I believe my suggestions may help with this.
Some of the formula get more complex if there is a mix of 2 and 3 character numbers.
Some of the formulas may require array enter unless you have Excel 365 or 2021.

"see how and if the shading/colouring of cells gives the same/right instant visual appearance."
Excel can colour cells via conditional formatting. For example if cell is >150 highlight in Red.

N.B. Please consider downloading the forum's tool called XL2BB. You will then be able to provide an extract of your sheet.

I updated some of the suggestions. I used an older version of Excel; the array formulas will now be highlighted.

The suggestions and formatting are not organized. Pull the information that seems useful. Ask questions.

You can copy my Excel extract to a clean sheet. Click on the icon below the f(x) in the heading and then move to your sheet and paste.

T202211a.xlsm
ABCDEFGHIJKLMNO
1#1#2#3DiastolicSystolicPulse
294/69-7696/72-7496/72-6695.371.072.0
398/69-7696/72-7499/72-6697.771.072.0
4115/69-7296/72-7499/70-68103.370.371.3
5120/70-6696/72-7499/70-104105.070.781.3
6
7106.7569.2572.5100.370.874.2
8
9106.75/69.25-72.5100/70-74
10106/69-72100/70-74
11
12
13#1#2#3AveragesBlood Pressure
1494/69-7696/72-7496/72-6695.371.072.095/71-72not recommended
15Alternative98/69-7696/72-7499/72-6697.771.072.097/71-72not recommended
16
17AveragesNot recommended
18DateDiastolic 1Diastolic 2Diastolic 3Systolic 1Systolic 2Systolic 3Pulse 1Pulse 2Pulse 3Diastolic SystolicPulse
192-Nov-221159696697272767466102.371.072.0102/71-72102/71-72
20
2a
Cell Formulas
RangeFormula
E2:E5E2=AVERAGE(--MID(B2:D2,1,FIND("/",B2:D2)-1))
F2:F5F2=AVERAGE(--MID(B2:D2,FIND("/",B2:D2)+1,2))
G2:G5G2=AVERAGE(--MID(B2:D2,FIND("-",B2:D2)+1,99))
B7B7=AVERAGE(--MID(B2:B5,1,FIND("/",B2:B5)-1))
C7C7=AVERAGE(--MID(B2:B5,FIND("/",B2:B5)+1,2))
D7D7=AVERAGE(--RIGHT(B2:B5,2))
E7:G7E7=AVERAGE(E2:E5)
B9B9=AVERAGE(--MID(B2:B5,1,FIND("/",B2:B5)-1))&"/"&AVERAGE(--MID(B2:B5,FIND("/",B2:B5)+1,2))&"-"&AVERAGE(--RIGHT(B2:B5,2))
B10B10=INT(AVERAGE(--MID(B2:B5,1,FIND("/",B2:B5)-1)))&"/"&INT(AVERAGE(--MID(B2:B5,FIND("/",B2:B5)+1,2)))&"-"&INT(AVERAGE(--RIGHT(B2:B5,2)))
G9G9=INT(E7)&"/"&INT(F7)&"-"&INT(G7)
G10G10=INT(AVERAGE(E2:E5))&"/"&INT(AVERAGE(F2:F5))&"-"&INT(AVERAGE(G2:G5))
E14E14=AVERAGE(--MID(B14:D14,1,2))
F14F14=AVERAGE(--MID(B14:D14,4,2))
G14G14=AVERAGE(--MID(B14:D14,7,2))
E15E15=ROUND(AVERAGE(--MID(B15:D15,1,2)),1)
F15F15=ROUND(AVERAGE(--MID(B15:D15,4,2)),1)
G15G15=ROUND(AVERAGE(--MID(B15:D15,7,2)),1)
I14I14=TEXT(AVERAGE(--MID(B14:D14,1,2)),"##")&"/"&TEXT(AVERAGE(--MID(B14:D14,4,2)),"##")&"-"&TEXT(AVERAGE(--MID(B14:D14,7,2)),"##")
I15I15=INT(AVERAGE(--MID(B15:D15,1,2)))&"/"&INT(AVERAGE(--MID(B15:D15,4,2)))&"-"&INT(AVERAGE(--MID(B15:D15,7,2)))
K19K19=AVERAGE(B19:D19)
L19L19=AVERAGE(E19:G19)
M19M19=AVERAGE(H19:J19)
N19N19=INT(K19)&"/"&INT(AVERAGE(E19:G19))&"-"&INT(M19)
O19O19=INT(AVERAGE(B19:D19))&"/"&INT(AVERAGE(E19:G19))&"-"&INT(AVERAGE(H19:J19))
Press CTRL+SHIFT+ENTER to enter array formulas.
 
Upvote 0

Forum statistics

Threads
1,215,088
Messages
6,123,057
Members
449,091
Latest member
ikke

We've detected that you are using an adblocker.

We have a great community of people providing Excel help here, but the hosting costs are enormous. You can help keep this site running by allowing ads on MrExcel.com.
Allow Ads at MrExcel

Which adblocker are you using?

Disable AdBlock

Follow these easy steps to disable AdBlock

1)Click on the icon in the browser’s toolbar.
2)Click on the icon in the browser’s toolbar.
2)Click on the "Pause on this site" option.
Go back

Disable AdBlock Plus

Follow these easy steps to disable AdBlock Plus

1)Click on the icon in the browser’s toolbar.
2)Click on the toggle to disable it for "mrexcel.com".
Go back

Disable uBlock Origin

Follow these easy steps to disable uBlock Origin

1)Click on the icon in the browser’s toolbar.
2)Click on the "Power" button.
3)Click on the "Refresh" button.
Go back

Disable uBlock

Follow these easy steps to disable uBlock

1)Click on the icon in the browser’s toolbar.
2)Click on the "Power" button.
3)Click on the "Refresh" button.
Go back
Back
Top