Hi, I am a novice and am struggling with the below. Any help on this is highly appreciated please.
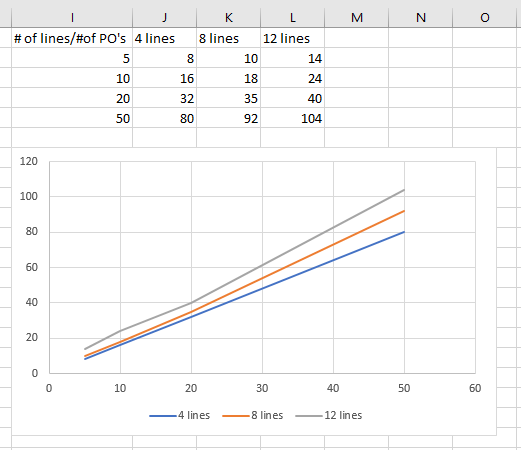
[FONT="]Produce a simple graph – 1 graph with 3 plotted lines on it – whereby the axes accommodate full and accurate spatial dimensions. Not just accommodating the supplied raw data points evenly across the axis .[/FONT]
[FONT="] [/FONT]
<tbody>
</tbody>
[FONT="]
[/FONT]
[FONT="] Axes = PO’s AND minutes. Plotted lines = each of the 3 line numbers scenarios. Is this doable?
[/FONT]
[FONT="]Produce a simple graph – 1 graph with 3 plotted lines on it – whereby the axes accommodate full and accurate spatial dimensions. Not just accommodating the supplied raw data points evenly across the axis .[/FONT]
[FONT="] [/FONT]
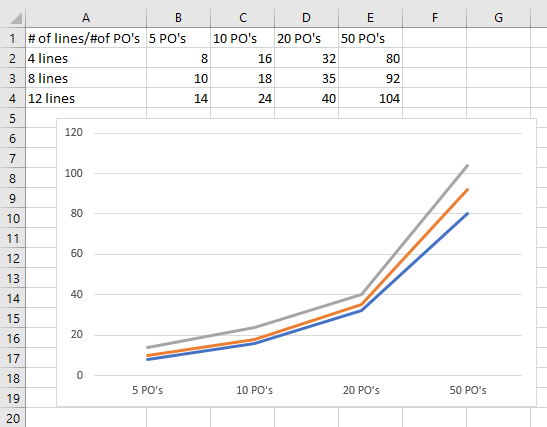
| [FONT="]# of lines/#of PO's[/FONT] | [FONT="]5 PO's[/FONT] | [FONT="]10 PO's[/FONT] | [FONT="]20 PO's[/FONT] | [FONT="]50 PO's[/FONT] |
| [FONT="]4 lines[/FONT] | [FONT="]8 min[/FONT] | [FONT="]16 min[/FONT] | [FONT="]32 min[/FONT] | [FONT="]80 min[/FONT] |
| [FONT="]8 lines[/FONT] | [FONT="]10 min[/FONT] | [FONT="]18 min[/FONT] | [FONT="]35 min[/FONT] | [FONT="]92 min[/FONT] |
| [FONT="]12 lines[/FONT] | [FONT="] 14 min[/FONT] | [FONT="]24 mins[/FONT] | [FONT="]40 min[/FONT] | [FONT="]104 min[/FONT] |
<tbody>
</tbody>
[FONT="]
[/FONT]
[FONT="] Axes = PO’s AND minutes. Plotted lines = each of the 3 line numbers scenarios. Is this doable?
[/FONT]