qureshi2016
New Member
- Joined
- Jan 7, 2016
- Messages
- 8
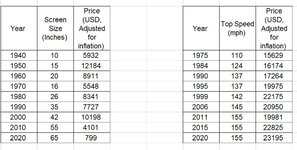
Hi i have 2 tables of different product in both tables common factor is price and year but product type is different can you please support to create this in 1 graph i can do this in 2 graphs but i want both products in 1 graph.
Let say 1 product tv screen size average annual price 5 years(2016 to 2020) from 18'' 21" 24" 30"
2nd product car type as per speed 100mph 120 mph 125mph 150mph annual price with average for 5 years (2016 to 2020)
I need both products in 1 graph in excel.
Let say 1 product tv screen size average annual price 5 years(2016 to 2020) from 18'' 21" 24" 30"
2nd product car type as per speed 100mph 120 mph 125mph 150mph annual price with average for 5 years (2016 to 2020)
I need both products in 1 graph in excel.