Morning
Just found a great add in which is 3D maps, and I really like it. Has anyone used it to plot regions by postcode. So say for example all Postcodes RG31 4 (sub code) belongs to Depot 2, and all postcodes RG31 5 (sub code) belongs to Depot 1. I would like to produce an interactive map that shows regions covered by each depot? Is this possible?
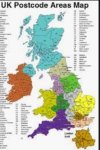
Many thanks, I can do the easier things with basic tables but not doing so well with trying to produce the attached.
Just found a great add in which is 3D maps, and I really like it. Has anyone used it to plot regions by postcode. So say for example all Postcodes RG31 4 (sub code) belongs to Depot 2, and all postcodes RG31 5 (sub code) belongs to Depot 1. I would like to produce an interactive map that shows regions covered by each depot? Is this possible?
Many thanks, I can do the easier things with basic tables but not doing so well with trying to produce the attached.