Dear all,
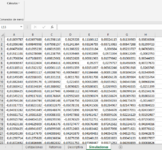
I would have your support. I have a code that compute simulacions with random variables of a stock portfolio choosing how many days and how may simulations. Here the code that, after computing average and volatility of a sort of data, run the simulation and after the simulation i have create a code that create the graph. The problem is that, on the page of Simulciones I would add:
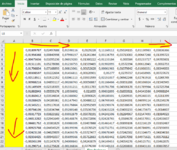
point 1- on column A the day number as 1,2,3 -> A2=day 1, A3=day 2, A4= day 3 and so on (highlighted in yellow in the photo)
point 2- on row A1 the name Date
point 3-from row B2= Simulaciones 1, C2= Simulaciones 2 and so on (highlighted in yellow in the photo)
So i would help specially for point 1 and point 3 becasue when i run the code for graph generatin, after adding the code created for days, the code select only the column B2:B
Here the code of random simulation
Here the code for graph generation
Here the code for days created and is missing the simulaciones one
Thanks to all, Davide
I would have your support. I have a code that compute simulacions with random variables of a stock portfolio choosing how many days and how may simulations. Here the code that, after computing average and volatility of a sort of data, run the simulation and after the simulation i have create a code that create the graph. The problem is that, on the page of Simulciones I would add:
point 1- on column A the day number as 1,2,3 -> A2=day 1, A3=day 2, A4= day 3 and so on (highlighted in yellow in the photo)
point 2- on row A1 the name Date
point 3-from row B2= Simulaciones 1, C2= Simulaciones 2 and so on (highlighted in yellow in the photo)
So i would help specially for point 1 and point 3 becasue when i run the code for graph generatin, after adding the code created for days, the code select only the column B2:B
Here the code of random simulation
VBA Code:
    Application.Run "ATPVBAEN.XLAM!Random", "Simulaciones", N_sim.Value, Dias.Value, 2, , _
    Cells(13, 2).Value, Cells(14, 2).Value
    Worksheets("Simulaciones").Move After:=Worksheets(Worksheets.Count)
Here the code for graph generation
VBA Code:
Option Explicit
' macro para crear grafico en nuevo book
Sub AddGrafico()

Dim lastrow As Long, lastcolumn As Long
    lastrow = Worksheets("Simulaciones").Cells(Rows.Count, 1).End(xlUp).Row
    lastcolumn = Worksheets("Simulaciones").Cells(1, Columns.Count).End(xlToLeft).Column
    Worksheets("Simulaciones").Range("A1", Cells(lastrow, lastcolumn)).Select

'crear y mostrar grafico
    ActiveSheet.Shapes.AddChart2(227, xlLineMarkers).Select
    ActiveChart.ChartTitle.Select
    ActiveChart.ChartTitle.Text = "Portfolio Return"
    Selection.Format.TextFrame2.TextRange.Characters.Text = "Portfolio Return"
    ActiveChart.Axes(xlCategory).Select
    Selection.TickLabelPosition = xlLow
    ActiveChart.Location Where:=xlLocationAsNewSheet, Name:="Grafico"
    Sheets("Grafico").Select
    Sheets("Grafico").Move After:=Sheets(Sheets.Count)
End Sub
Here the code for days created and is missing the simulaciones one
VBA Code:
Sub Dias()


Dim ws As Worksheet

Dim lastRow As Long


Set ws = Worksheets("Simulaciones")

Worksheets("Simulaciones").Activate

Rows("1:1").Select

Selection.Insert Shift:=xlDown, CopyOrigin:=xlFormatFromLeftOrAbove

Columns("A:A").Select

Selection.Insert Shift:=xlToRight, CopyOrigin:=xlFormatFromLeftOrAbove


lastRow = ws.Range("B" & ws.Rows.Count).End(xlUp).Row

ws.Range("A2:A" & lastRow).Formula = "=row()-1"


End Sub
Thanks to all, Davide