adriandwor
New Member
- Joined
- Sep 7, 2021
- Messages
- 19
- Office Version
- 2016
- Platform
- Windows
Hey guys,
I've about a week left to submit my final paper for my trade degree in transportation.
The paper is about an analysis of potential implementation of an electric car for direct deliveries in my area where I live.
In part of it, I try to analyze how many possible trips a car like that could have a day and from that deduce potential yearly earnings.
I have about 5000 data points of trips in the area that cover 1 year span.
Data looks something like this:
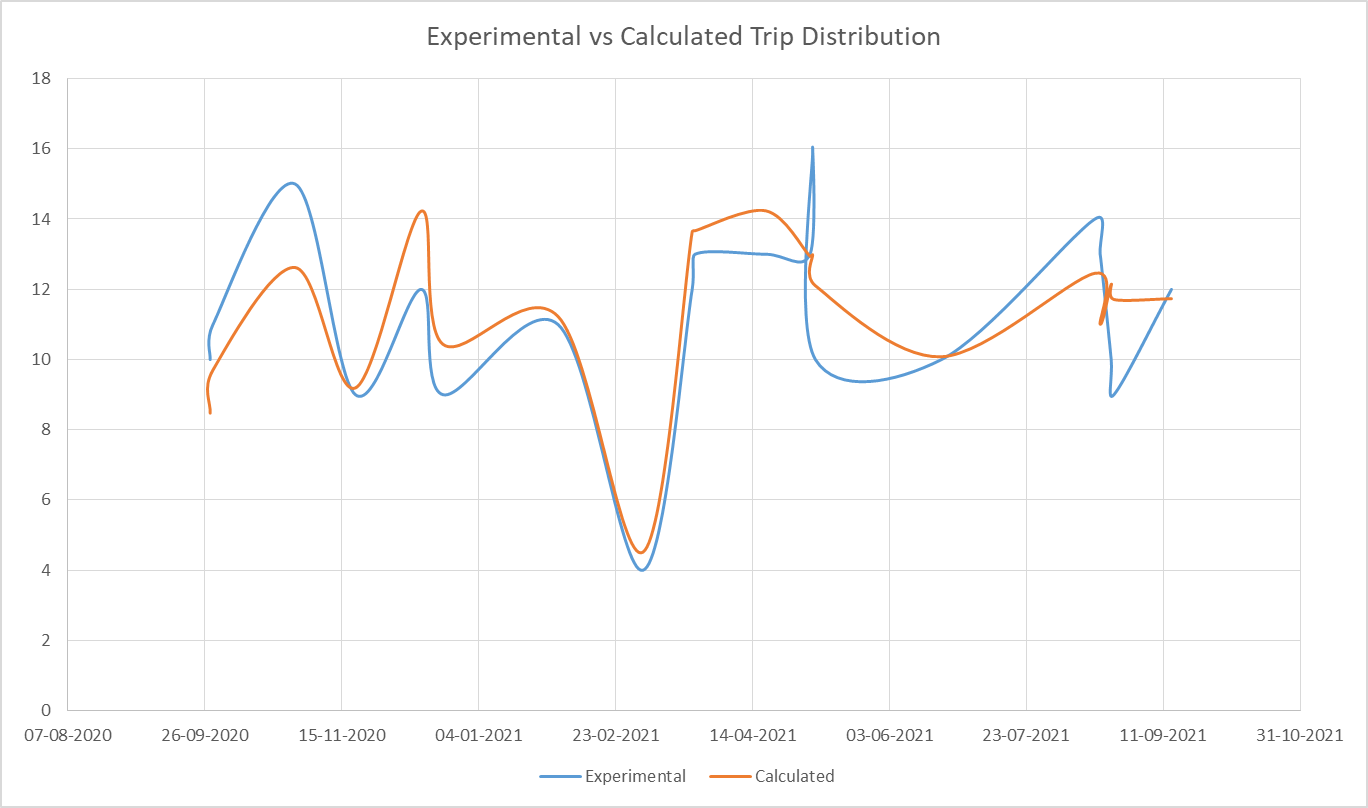
Experimental are trips that have been arranged manually according to the data. Calculated is where I used a formula:
Sqrt ((Available trips - Lowest_bound) +Overlap_Factor) + Lowest_bound
It seems to come very close to the actual number of trips an electric car can have on that day but I don't understand why it comes so close and I don't really understand why I used this formula. Maybe someone can explain if it's just luck or there is some reason for using a square root. I'll probably be asked why this formula at the presentation.
Available trips - Total of all available trips on that day in this area.
Lowest bound - Least amount of possible trips taken (I calculated it by having a total distance of driving all available chronologically trips one by one, the pure driving time by amount of trips and add 6 minutes for each trip for loading/unloading time. 6 minutes is the average load/unload for 5000 trips last year. It gives 39 minutes. Time a car is available on that day, divided by 39 minutes gives a lowest_bound number of trips.
Overlap factor - I've got help here on the forum to have excel count the number of overlapping trips on a particular day with the idea that more trips can be taken as coloads if they happen to be available for pickup within 30 minutes of each other and 15 min driving distance from one another. In that case trip counts as 1 extra in the same time as the other.
I figured some of the overlapping trips + some of the trips not taken in lowest_bound will also be driven. I used a square root for the calculation but I can't explain why other than I've seen an equation some time ago that uses a sqrt.
It seems to me like it works.
Can anyone explain why? I'm a bit worried I'll be asked at my presentation why I chose to do that.
I appreciate your time.
I've about a week left to submit my final paper for my trade degree in transportation.
The paper is about an analysis of potential implementation of an electric car for direct deliveries in my area where I live.
In part of it, I try to analyze how many possible trips a car like that could have a day and from that deduce potential yearly earnings.
I have about 5000 data points of trips in the area that cover 1 year span.
Data looks something like this:
| trekant_rigtigt.xlsx | ||||||||
|---|---|---|---|---|---|---|---|---|
| A | B | C | D | E | F | |||
| 1 | Date | Available trips | Most trips | Experimental | Calculated | Lowest_bound | ||
| 2 | 28-09-2020 | 12 | 11 | 10 | 8 | 6 | ||
| 3 | 29-09-2020 | 17 | 10 | 11 | 10 | 6 | ||
| 33 | 29-10-2020 | 24 | 18 | 15 | 13 | 8 | ||
| 55 | 20-11-2020 | 13 | 11 | 9 | 9 | 6 | ||
| 79 | 14-12-2020 | 16 | 16 | 12 | 14 | 11 | ||
| 87 | 22-12-2020 | 15 | 13 | 9 | 10 | 7 | ||
| 129 | 02-02-2021 | 14 | 15 | 11 | 11 | 9 | ||
| 160 | 05-03-2021 | 5 | 5 | 4 | 5 | 5 | ||
| 178 | 23-03-2021 | 20 | 16 | 12 | 14 | 9 | ||
| 179 | 24-03-2021 | 18 | 17 | 13 | 14 | 10 | ||
| 205 | 19-04-2021 | 18 | 17 | 13 | 14 | 10 | ||
| 221 | 05-05-2021 | 24 | 13 | 13 | 13 | 7 | ||
| 222 | 06-05-2021 | 24 | 18 | 16 | 13 | 8 | ||
| 223 | 07-05-2021 | 12 | 12 | 10 | 12 | 10 | ||
| 269 | 22-06-2021 | 15 | 12 | 10 | 10 | 7 | ||
| 325 | 17-08-2021 | 25 | 18 | 14 | 12 | 8 | ||
| 327 | 19-08-2021 | 19 | 12 | 13 | 11 | 7 | ||
| 331 | 23-08-2021 | 12 | 12 | 10 | 12 | 10 | ||
| 332 | 24-08-2021 | 16 | 14 | 9 | 12 | 8 | ||
| 353 | 14-09-2021 | 16 | 14 | 12 | 12 | 9 | ||
Omk_bounds (2) | ||||||||
| Cell Formulas | ||
|---|---|---|
| Range | Formula | |
| A353,A331:A332,A327,A325,A269,A221:A223,A205,A178:A179,A160,A129,A87,A79,A55,A33,A2:A3 | A2 | =Table3[@Dag] |
| B353,B331:B332,B327,B325,B269,B221:B223,B205,B178:B179,B160,B129,B87,B79,B55,B33,B2:B3 | B2 | =Table3[@[Antal ture]] |
| C353,C332,C327,C325,C269,C221:C222,C205,C178:C179,C129,C87,C55,C33,C2:C3 | C2 | =Table3[@[Tid til rådighed]]*1440/Calculations!$N$7 |
| E353,E331:E332,E327,E325,E269,E221:E223,E205,E178:E179,E160,E129,E87,E79,E55,E33,E2:E3 | E2 | =Table3[@[E2(tur)]]+Table3[@[Overlag faktor]] |
| F353,F331:F332,F327,F325,F269,F221:F223,F205,F178:F179,F160,F129,F87,F79,F55,F33,F2:F3 | F2 | =Table3[@[E2(tur)]] |
Experimental are trips that have been arranged manually according to the data. Calculated is where I used a formula:
Sqrt ((Available trips - Lowest_bound) +Overlap_Factor) + Lowest_bound
It seems to come very close to the actual number of trips an electric car can have on that day but I don't understand why it comes so close and I don't really understand why I used this formula. Maybe someone can explain if it's just luck or there is some reason for using a square root. I'll probably be asked why this formula at the presentation.
Available trips - Total of all available trips on that day in this area.
Lowest bound - Least amount of possible trips taken (I calculated it by having a total distance of driving all available chronologically trips one by one, the pure driving time by amount of trips and add 6 minutes for each trip for loading/unloading time. 6 minutes is the average load/unload for 5000 trips last year. It gives 39 minutes. Time a car is available on that day, divided by 39 minutes gives a lowest_bound number of trips.
Overlap factor - I've got help here on the forum to have excel count the number of overlapping trips on a particular day with the idea that more trips can be taken as coloads if they happen to be available for pickup within 30 minutes of each other and 15 min driving distance from one another. In that case trip counts as 1 extra in the same time as the other.
I figured some of the overlapping trips + some of the trips not taken in lowest_bound will also be driven. I used a square root for the calculation but I can't explain why other than I've seen an equation some time ago that uses a sqrt.
It seems to me like it works.
Can anyone explain why? I'm a bit worried I'll be asked at my presentation why I chose to do that.
I appreciate your time.


